Overview
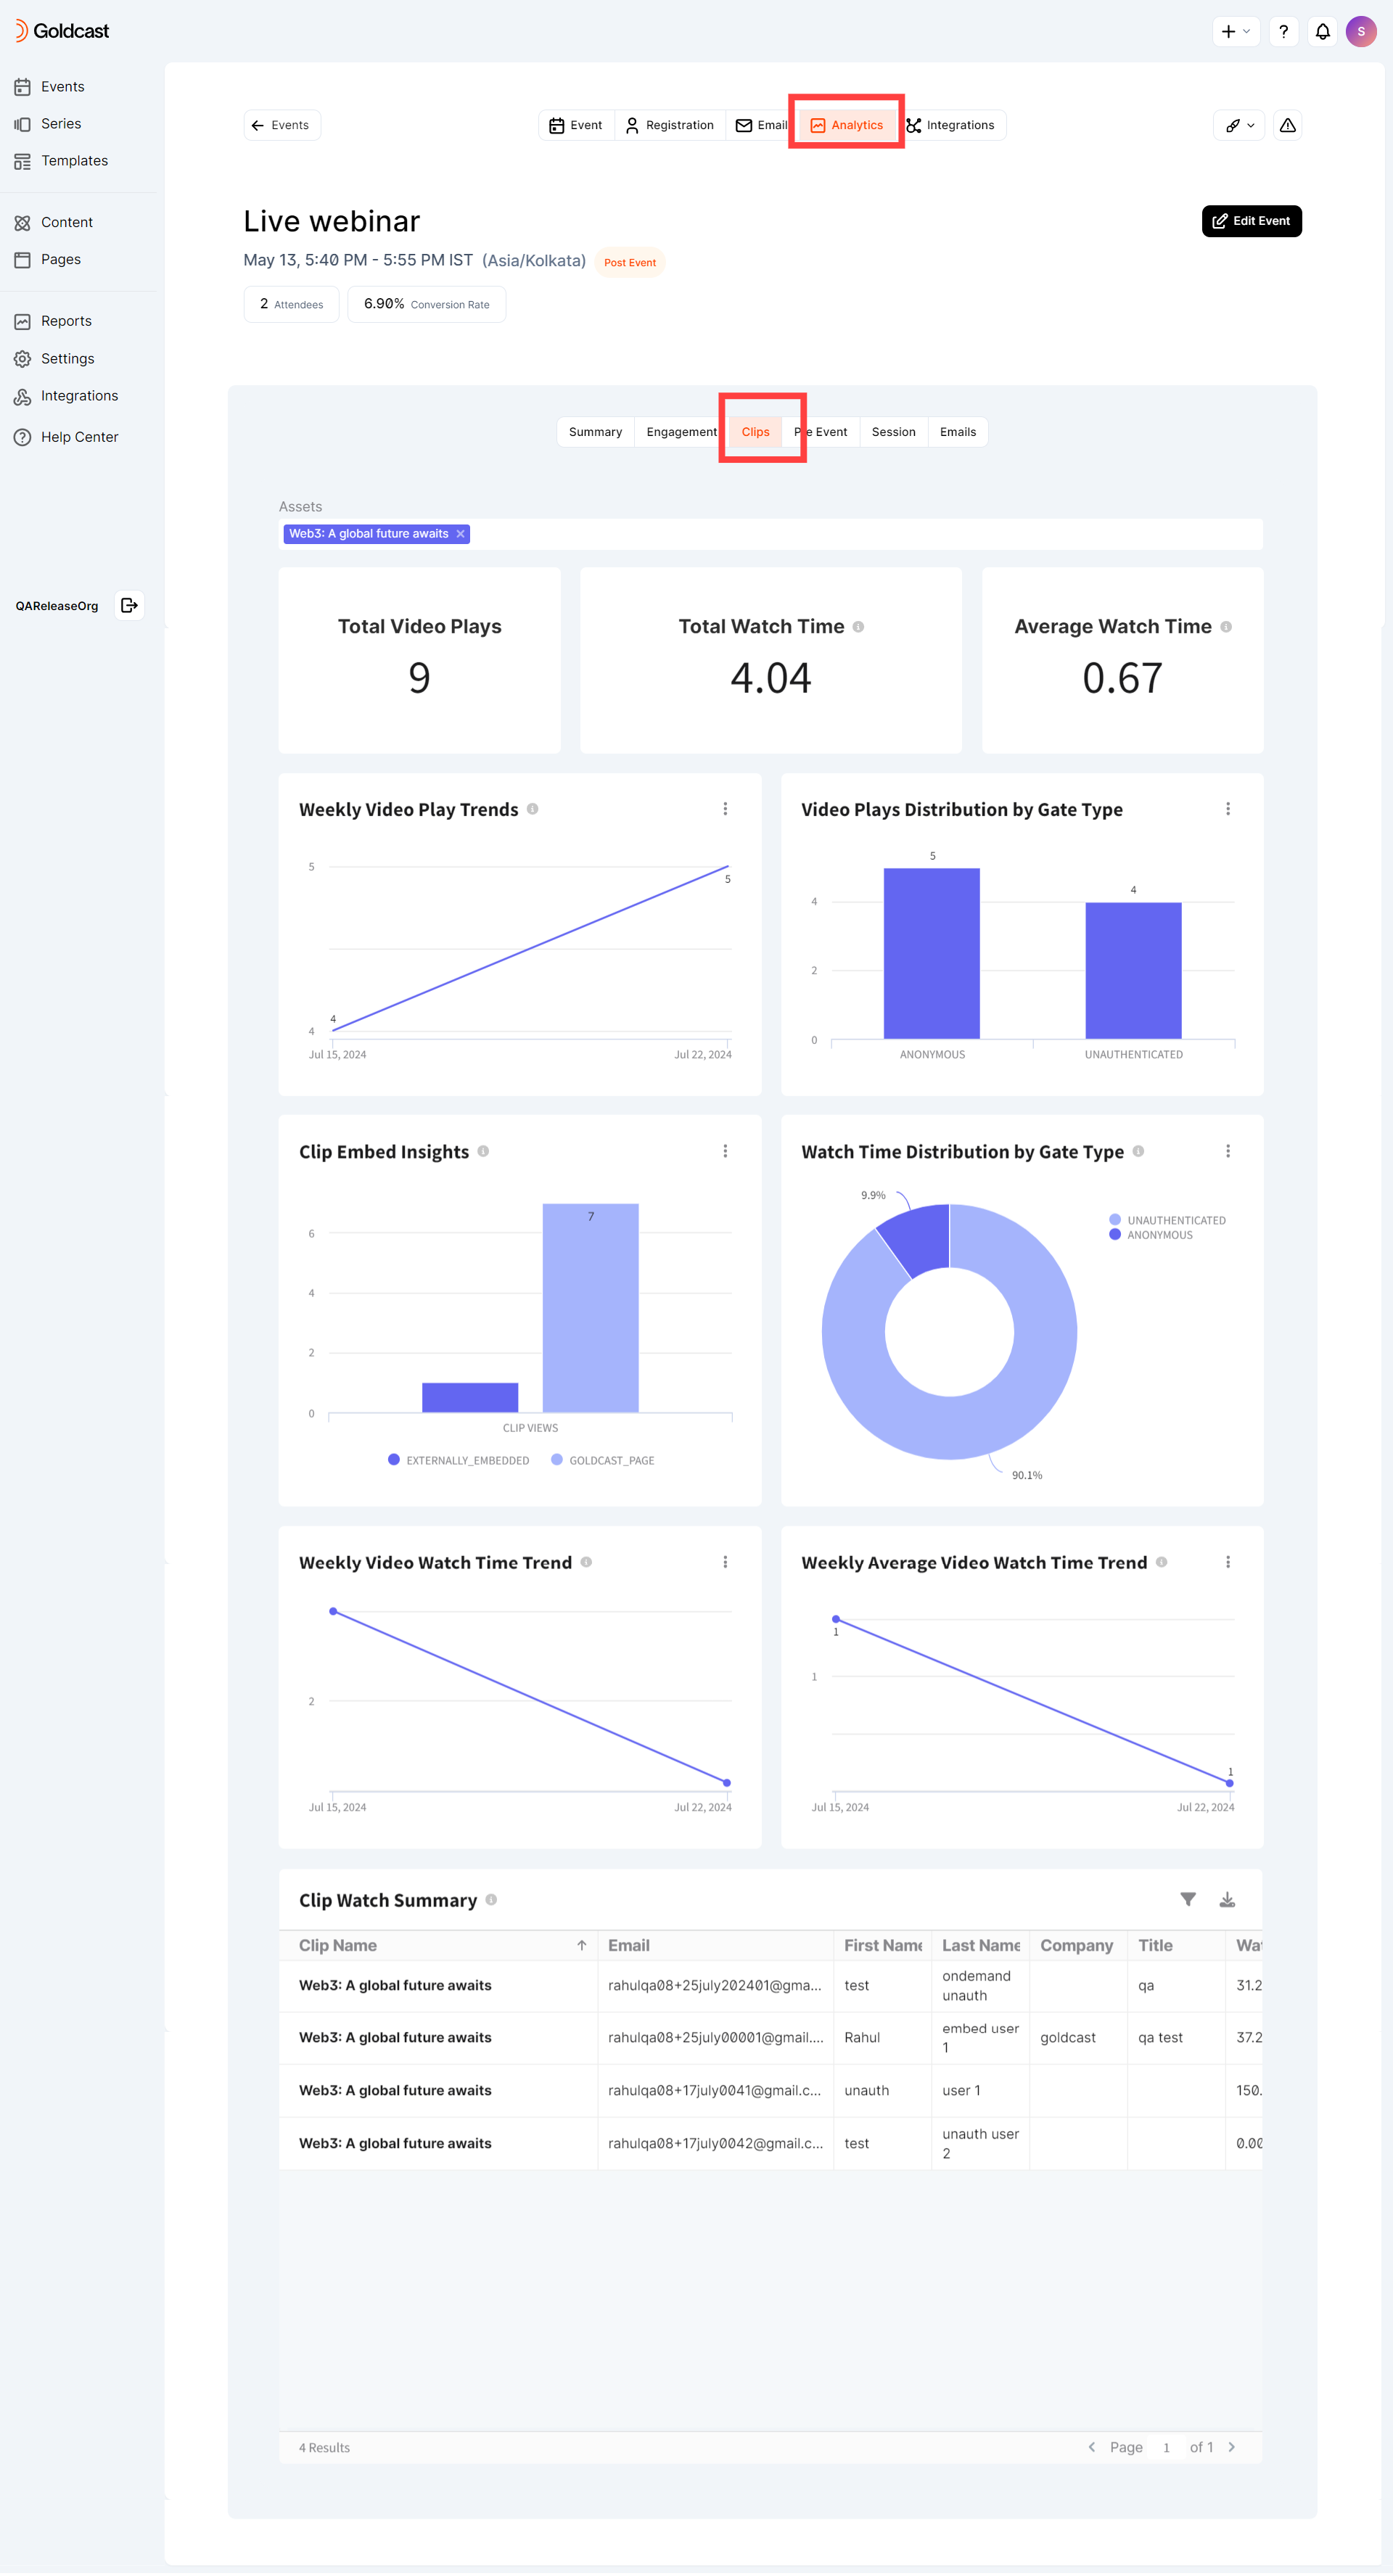
The Clips Analytics dashboard is a powerful tool for tracking the performance of the video clips on the on-demand page. It offers a snapshot of critical KPIs and metrics, such as play count, total watch time, average watch time, weekly video play trends, watch time distribution, clip embed insights, asset summary, and more. You can leverage these insights to optimize your on-demand videos and increase engagement.
How to access the clip analytics dashboard
The Clips Analytics dashboard is only available for webinars powered by Smart Event Technology, and you can see the data in this dashboard only after the webinar goes into on-demand mode.
- Login to Goldcast Studio and open your desired webinar powered by Smart Event Technology.
- Click the Analytics tab and navigate to the Clips tab.
Understanding the metrics in the dashboard
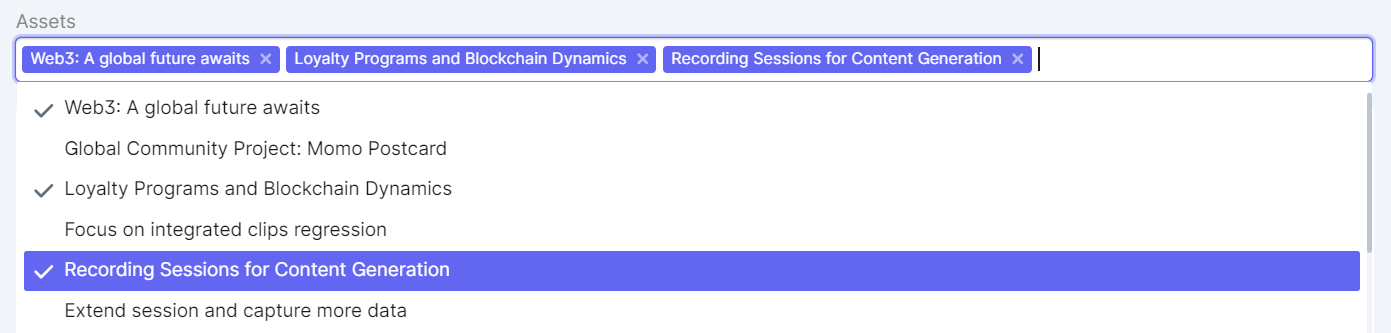 Use the Assets dropdown to select the video clips for which you want to track the metrics. This is a multi-select, and you can choose any number of assets as you require.
Video Plays and Watch Time
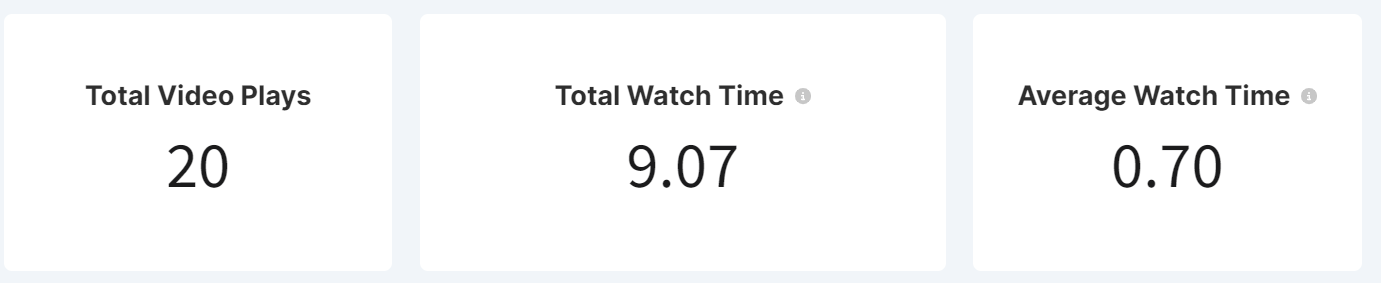
- Total Video Plays: The total number of plays of the selected video clips.
- Total Watch Time: The overall watch time of all selected video clips in minutes.
- Average Watch Time: The average watch time of the selected video clips in minutes.
Video Play Trends and Distribution
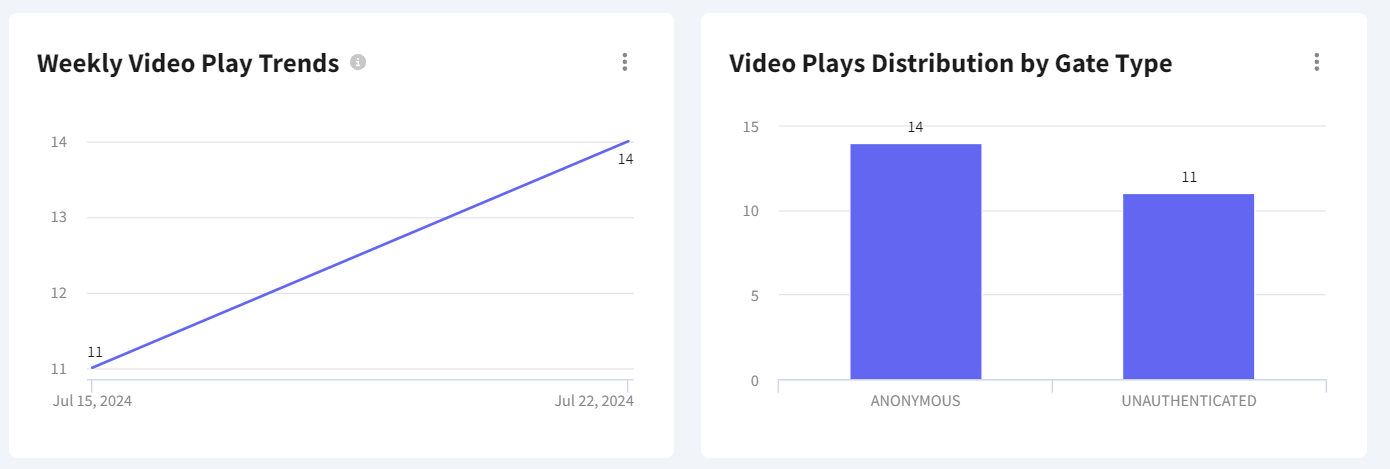
These graphs display the weekly video play trends and the gate type distribution.
- Anonymous: Total number of video plays without email sharing. (Applicable only for ungated on-demand pages.)
- Unauthenticated: Total number of video plays by users who shared their emails on the on-demand page but haven't registered for the webinar.
- Identified: Total number of video plays by webinar registrants.
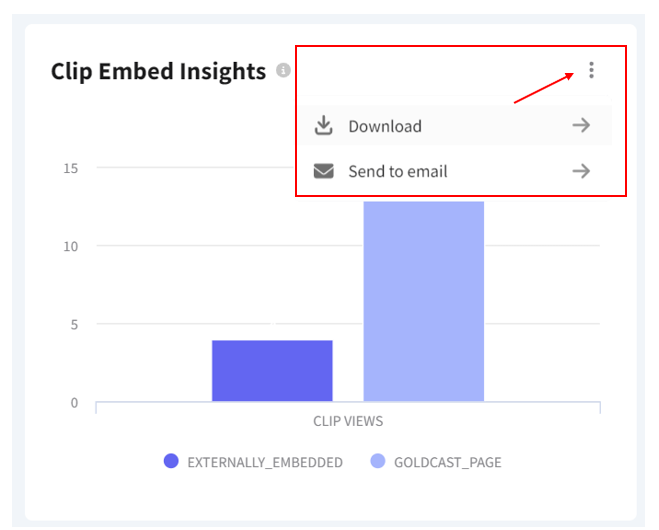
Clip Embed Insights
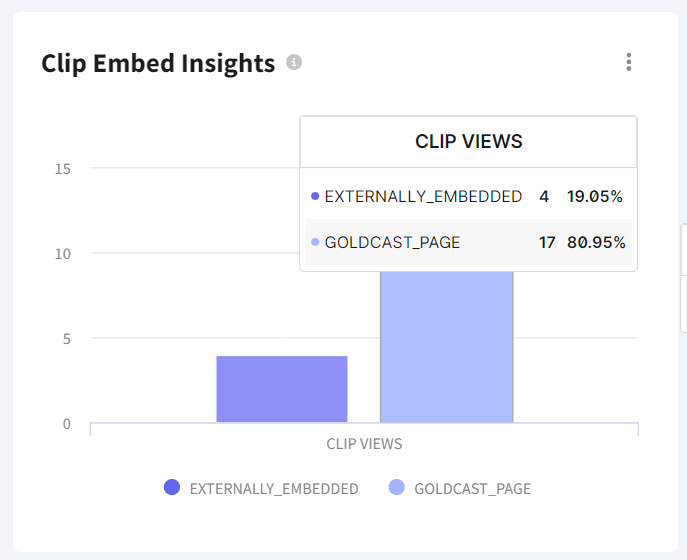
This graph provides in-depth performance details of video clips embedded in the Goldcast on-demand page compared to external embeds (if you have any).
Watch Time Distribution
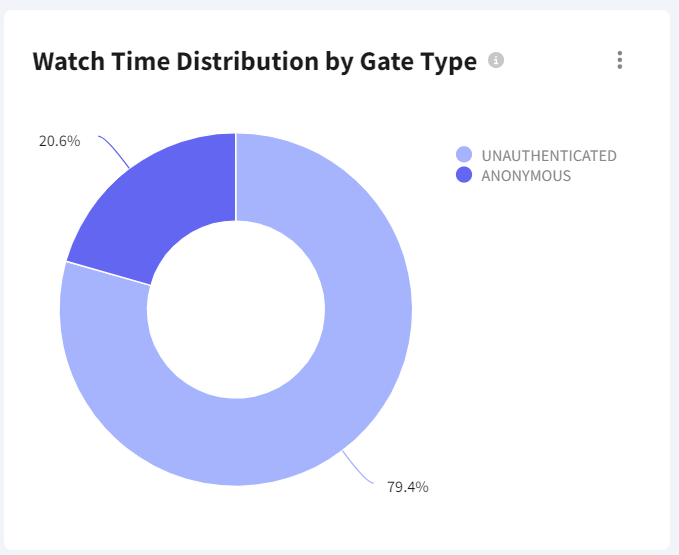
This piechart provides a breakdown of how video watch time is divided among identified, unauthenticated, and anonymous users. The chart will appear differently depending on whether your on-demand page is gated or ungated. If the page is gated, there won't be an anonymous column because all users must submit their email before viewing the content.
Weekly Video Watch Time Trends
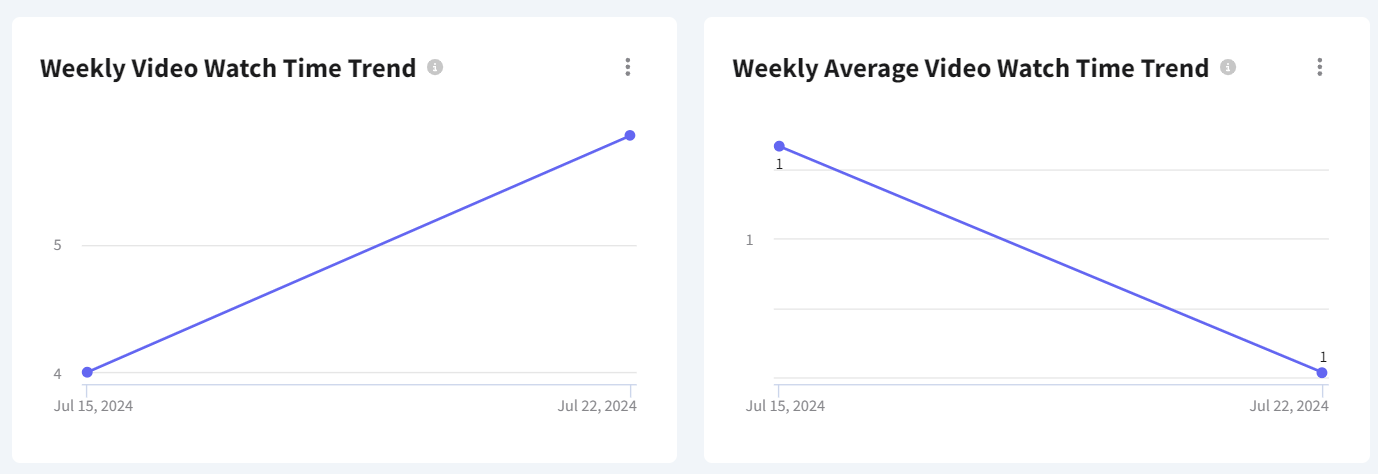
Use these graphs to track the weekly performance of your video clips.
Clip Watch Summary
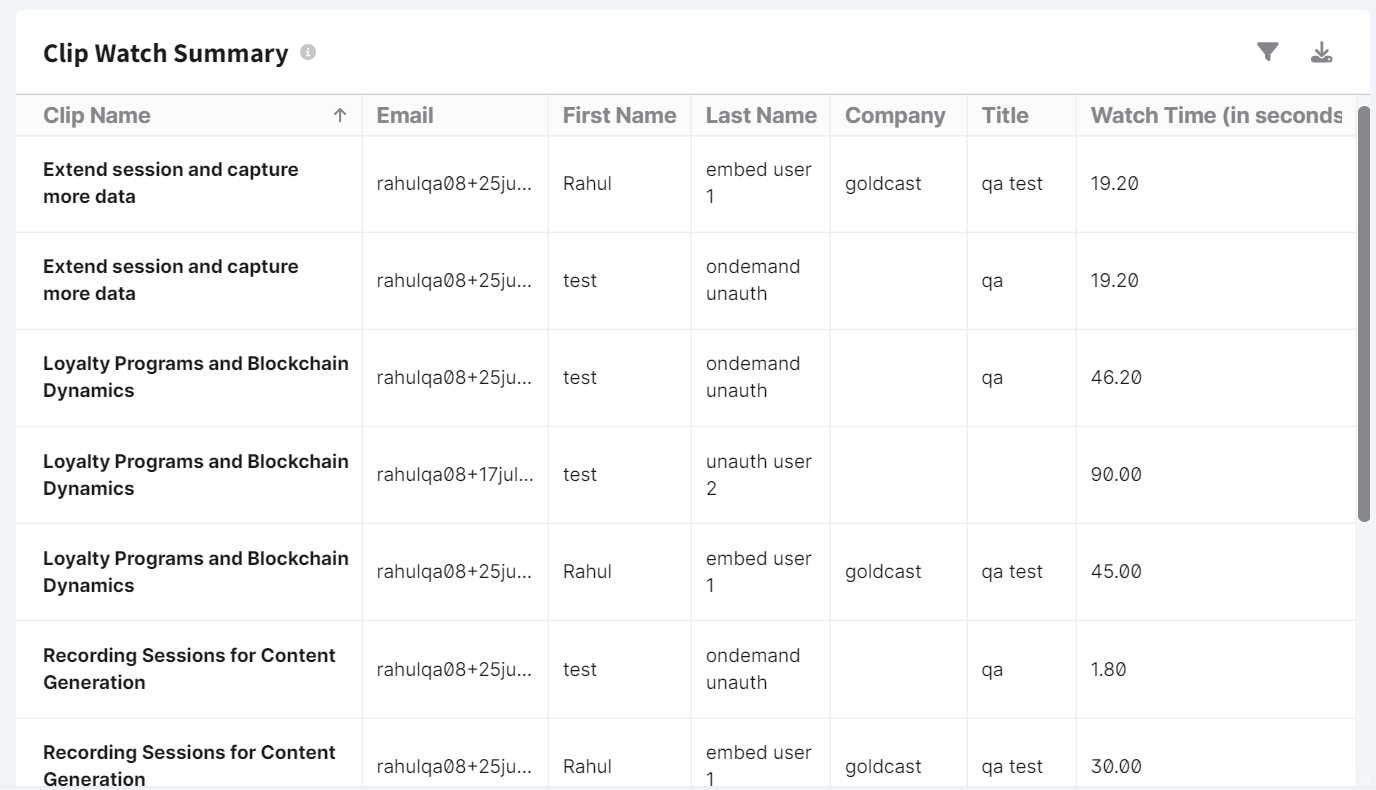
The Clip Watch Summary table provides in-depth details of each on-demand view. It includes the Email, First and Last Name, Company, Title, and watch time (in seconds) of each user who views the clips on your on-demand page.
Heads Up! This table includes only information collected from gated on-demand pages (either via the magic link or users submitting emails while entering). The Clip Watch Summary table will not include anonymous users' data.
FAQs
1. How do you download/share the analytics data?
Click the three vertical dots icon next to your desired chart/table. You can download or send the data to your email as a CSV, PDF, or image.
2. How frequently is the data updated on the Clips Analytics dashboard?
The Clips Analytics dashboard is updated 30 minutes after the user engagement action.