| Plan Availability | Starter | Pro | Premium | Enterprise |
 |
Add-on | Add-on | Add-on |
For customers with contracts starting March 2024 or later, feature availability is based on your pricing tier. If interested, contact your CSM or our Sales Team to discuss pricing options.
Goldcast offers a seamless way to access valuable event data and insights from your field events, right within Goldcast Studio. Furthermore, you can use our built-in native integrations to quickly sync event data with your preferred third-party CRMs and MAPs.
Event analytics
To access the analytics data for your field event:
- Login to Goldcast Studio and open your preferred field event from the Events list.
- Navigate to Analytics using the left navigation menu.
The Analytics section for field events offers three key reports:
1. Event Summary
Heads Up! The data displayed in the Event Summary dashboard varies depending on the event state. For example, if it's an upcoming event, it will display registration information. In contrast, for past events, you can see attendance data. For more information, refer to the Event Summary Report.
This page displays the key metrics of your field event, such as:
- Registrations: Total enrollments for your event.
- In-person attendees: Number of attendees who attended your event.
- Attendance rate: Measure of the number of attendees vs registrants.
- Companies: Count of distinct companies of event attendees.
- No-show: Details of registrants who didn’t attend the event.
- Attendance Distribution and Companies Distribution: These metrics are visualized as pie charts.
- The Event Summary table contains all registrant/attendee data related to their registration and attendance for the event.
 Note: The Event Attendance Status is set to N/A for waitlisted, canceled or rejected registrants.
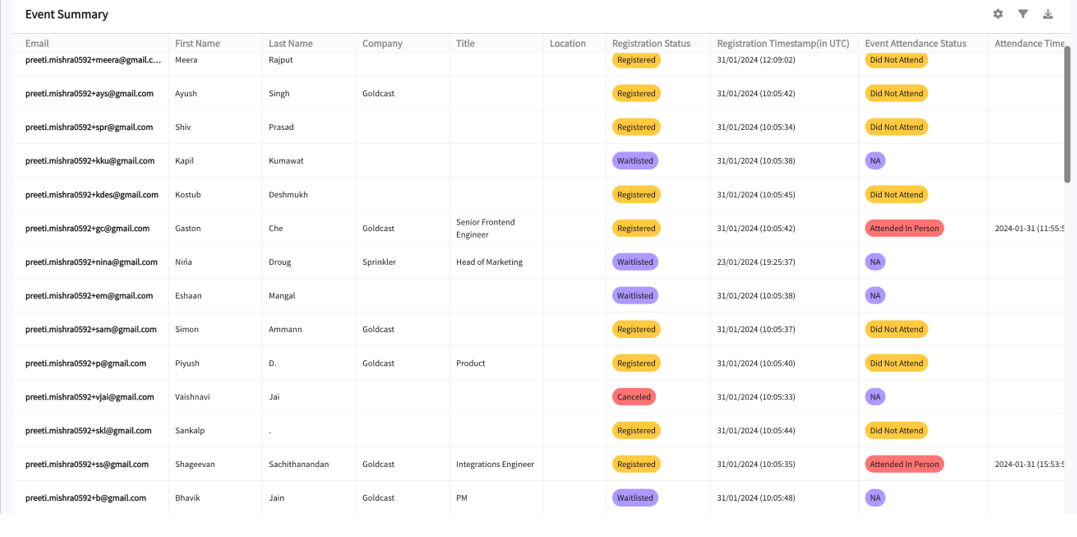
The next table on this page is the Event No-Shows table, which provides details of registrants who didn't attend the event. 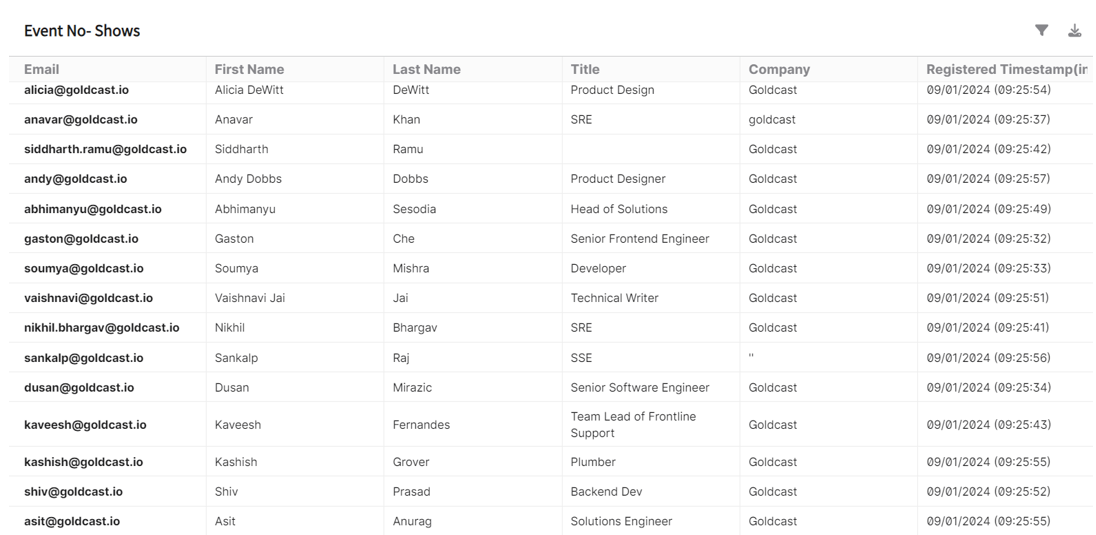
The columns of both tables are dynamic and populated based on the type of activities captured during the event. Use the filter and settings icons to configure these tables to view only certain columns that you require. You can quickly download all the information on this page as PDF or CSV or send it to your email.
2. Pre-event
The Pre-Event Analytics dashboard provides access to data before an event takes place. You can see the Daily Registration Count, Event Registrant Details, Registrants by Company, Event Registration by Domain, and Registrant Titles.
For more information, refer to the Pre-Event Analytics Dashboard.
3. Emails
The Emails Analytics dashboard provides detailed information about your email traffic, such as the number of delivered, opened and bounced emails. You can also get insights about how registrants engage with elements of your emails, such as links and calendar invitations.
For more information, refer to Email Analytics Dashboard.
Integrations
Goldcast automatically syncs registration and attendance data with your connected CRMs and MAPs. All third-party integrations we support for virtual events are also available for field events. This includes Salesforce, Marketo, Slack + Salesforce, Slack, HubSpot, Eloqua, Pardot, Webhooks, and more.
Heads Up! You can only sync registration and attendance data for field events.
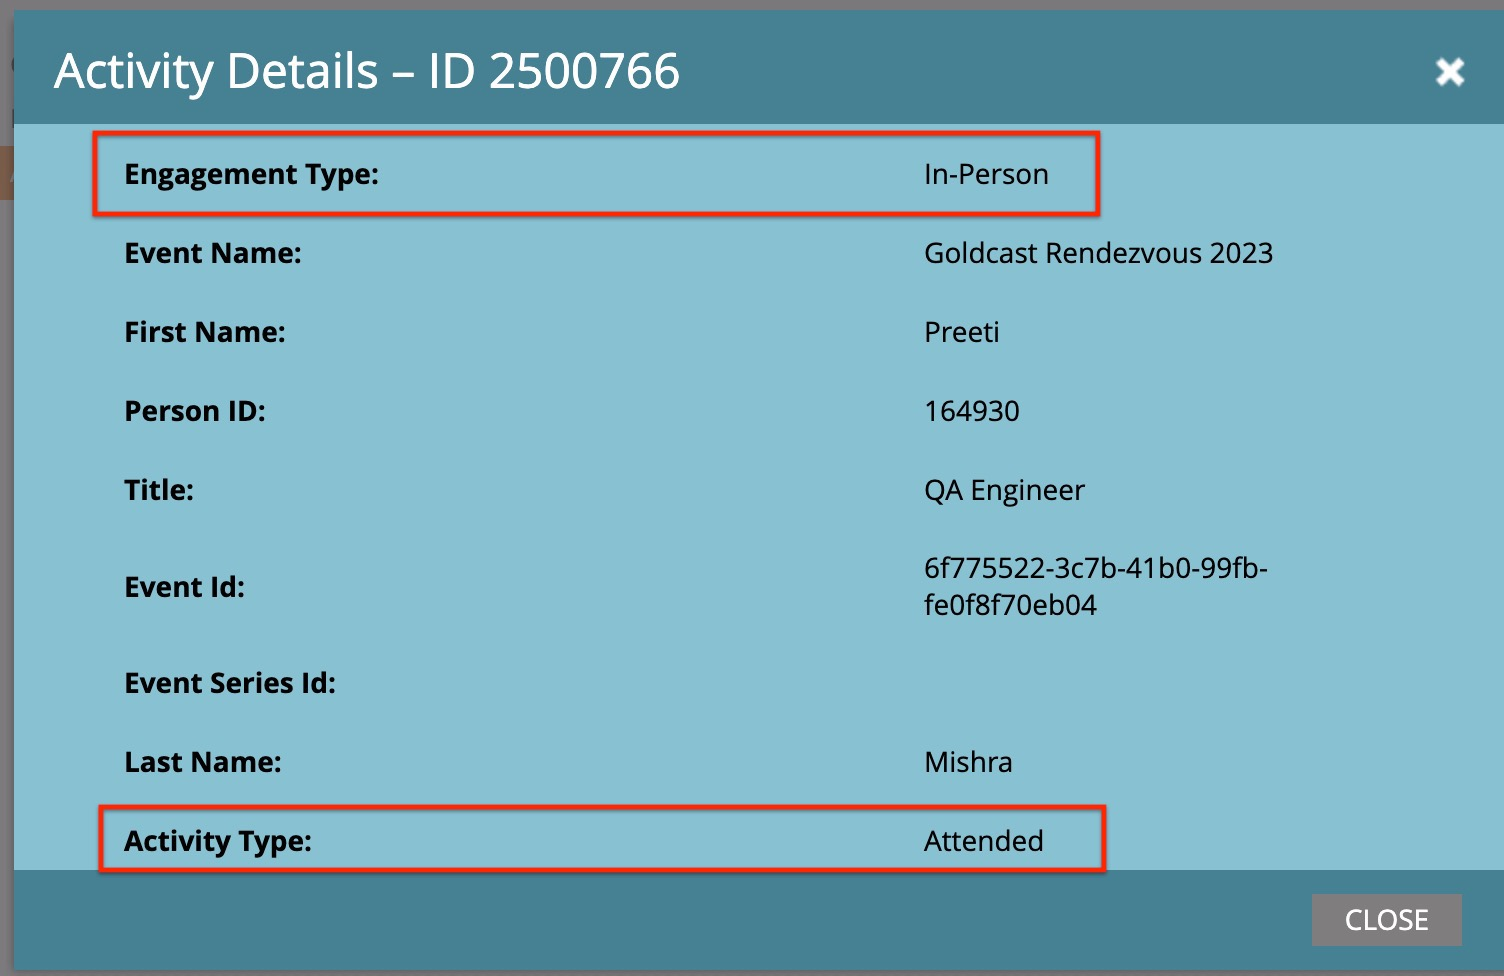
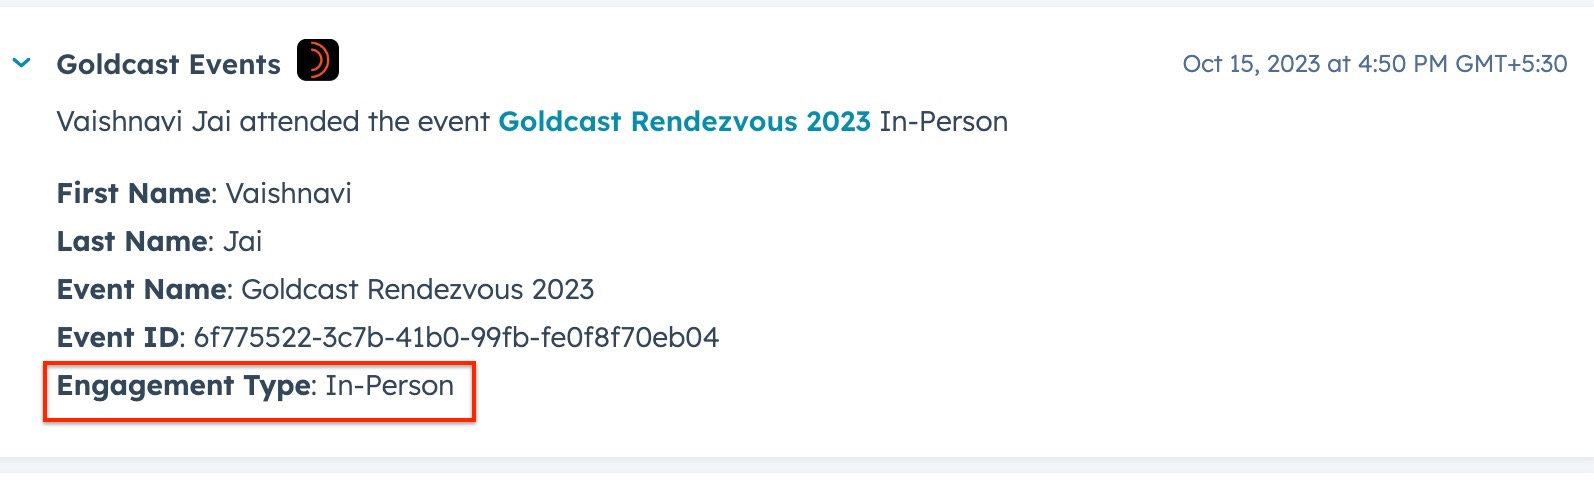
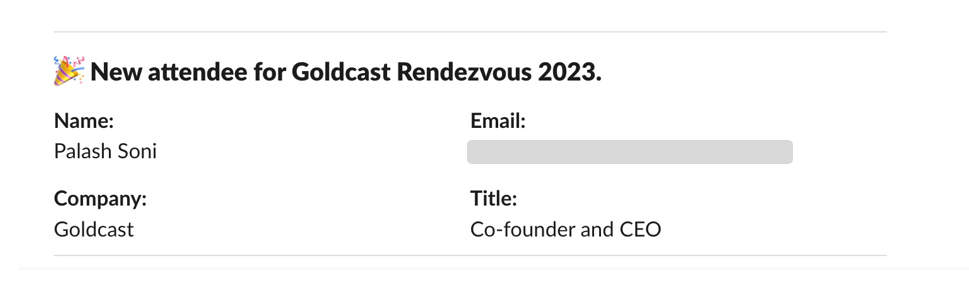
Here are a few examples of how your field event data passes to specific CRMs and MAPs.
Follow these steps to turn on/off specific integrations for your field event:
- Login to Goldcast Studio using your credentials, and open your preferred field event from the Events list.
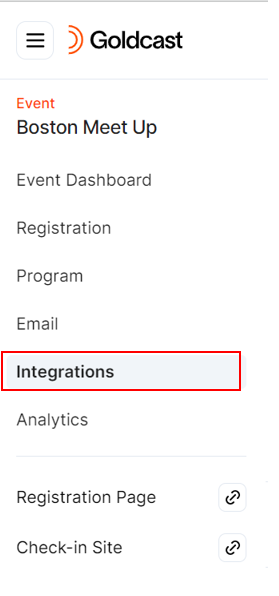
- Navigate to Integrations using the left navigation menu.
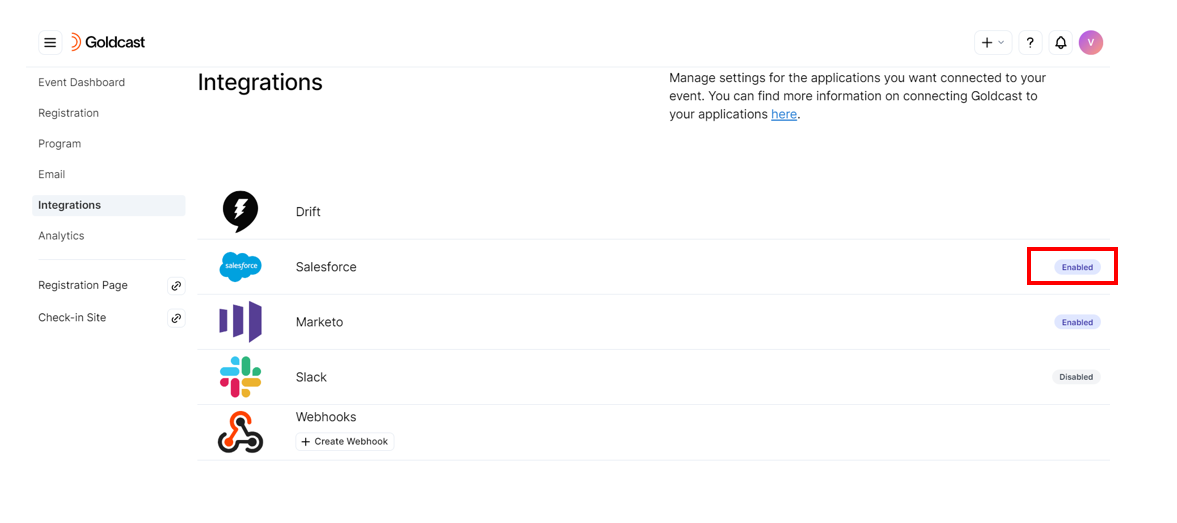
- Click on the integration you want to connect/disconnect.
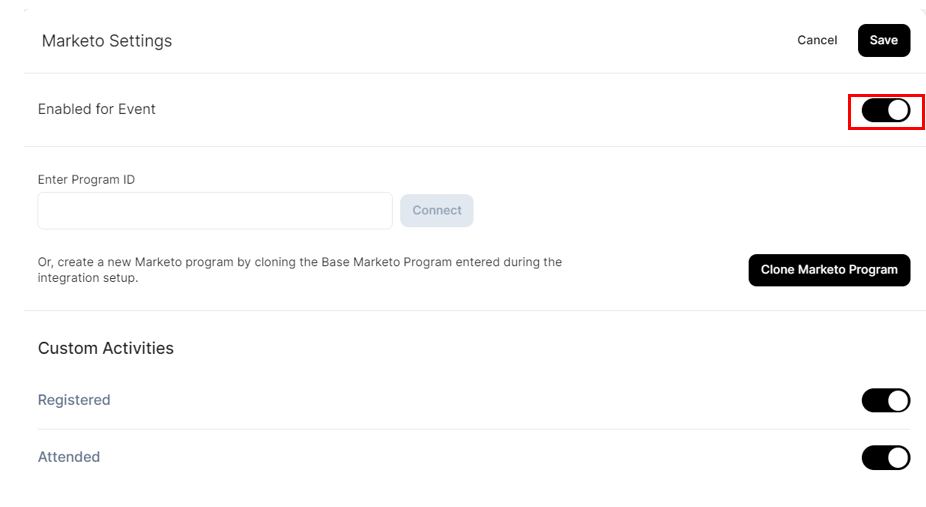
- Use the Enabled for Event toggle to turn on/off specific integrations for your event.
For detailed information on connecting your field event with specific CRMs and MAPs, refer to our Integrations docs.
Integration sync times
Once you’ve successfully set up third-party integrations, Goldcast syncs the field event's data to corresponding CRMs and MAPs one hour after the event's end time. In the case of multi-day events, data synchronization occurs after the final day.
The only exceptions are Slack and Slack + Salesforce notifications. All notifications for registrations and attendance occur in real-time, just like for virtual and hybrid events in the Goldcast platform.
Note: If you undo check-in for a guest, there will be no additional notifications in Slack and Slack + Salesforce.
Sync check-in QR code links
You can sync attendee check-in QR code links to connected CRMs and MAPs. This is set up at the organizational level via field mapping.
This sends ONLY QR code links and not the actual QR code images.
To do this,
- Login to Goldcast Studio using your credentials, and navigate to the Integrations tab.
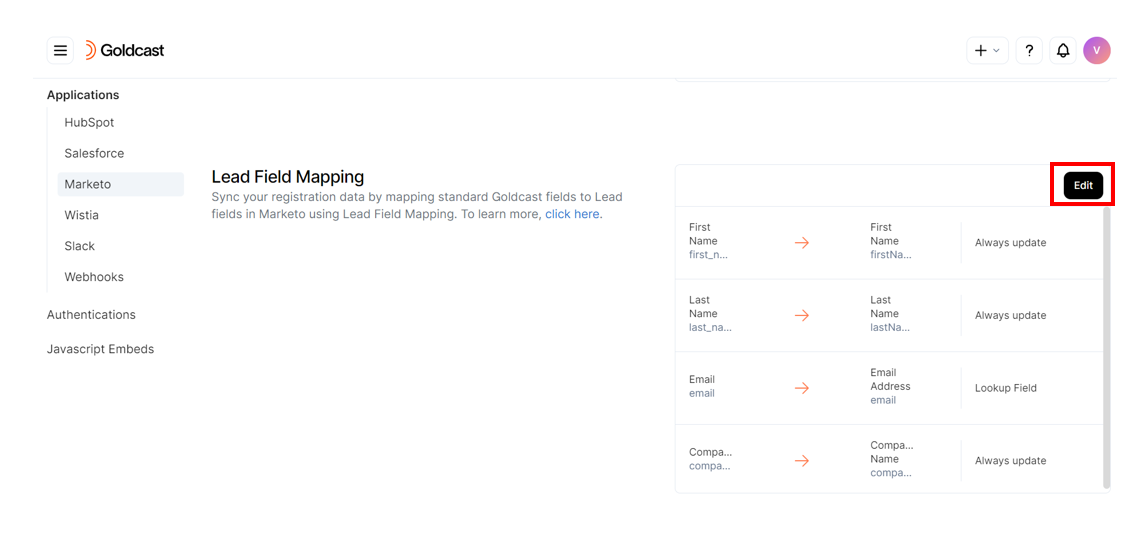
- This brings you to the list of connected CRMs and MAPs. Select your preferred application, scroll to the Field Mapping section and click Edit.
- Click the +Add Mapping button and select the field QR Code URL (qrcode_url) in Goldcast and an appropriate field in your target system.
- Click Save.
Sync Notes collected during registrant check-in
During check-in, you can add notes to each guest's registration profile. The information collected in this field can be synced to connected CRMs and MAPs.
To do this,
- Login to Goldcast Studio using your credentials, and navigate to the Integrations tab.
- This brings you to the list of connected CRMs and MAPs. Select your preferred application, scroll to the Field Mapping section and click Edit.
- Click the +Add Mapping button and select the field Event Notes (event_notes) in Goldcast and an appropriate field in your target system.
- Click Save.