| Plan Availability | Starter | Pro | Premium | Enterprise |
 |
 |
|
|
For customers with contracts starting March 2024 or later, feature availability is based on your pricing tier. If interested, contact your CSM or our Sales Team to discuss pricing options.
Overview
The event ROI dashboard provides event organizers with a clear and easy way to assess event performance post-event through metrics such as pipeline sourced, pipeline influenced, revenue sourced, and revenue influenced over a time frame.
Additionally, organizers can identify highly engaged accounts immediately post-event and pass the information to the sales team to get better conversions from outbound strategy
Pre-requisites
- You need to have Goldcast’s Managed Package (version 1.4.2+) installed in your Salesforce Instance. This version was published on 1st June 2023.
- On the Goldcast platform, you will also need to authenticate with Salesforce Sales Cloud App.
- Detailed instructions can be found in the Goldcast Salesforce Integration help doc.
Getting to ROI Reporting Dashboard
- Log in to Goldcast Studio with your credentials and select the Reports tab in the left sidebar.
- You will land on the Cross-Event Reporting tab.
- Navigate to the ROI Reporting tab on the left side of the screen.
- By default, the ROI Dashboard will display your pipeline and revenue report since the beginning of the year. You can change this by using the filters on this page.
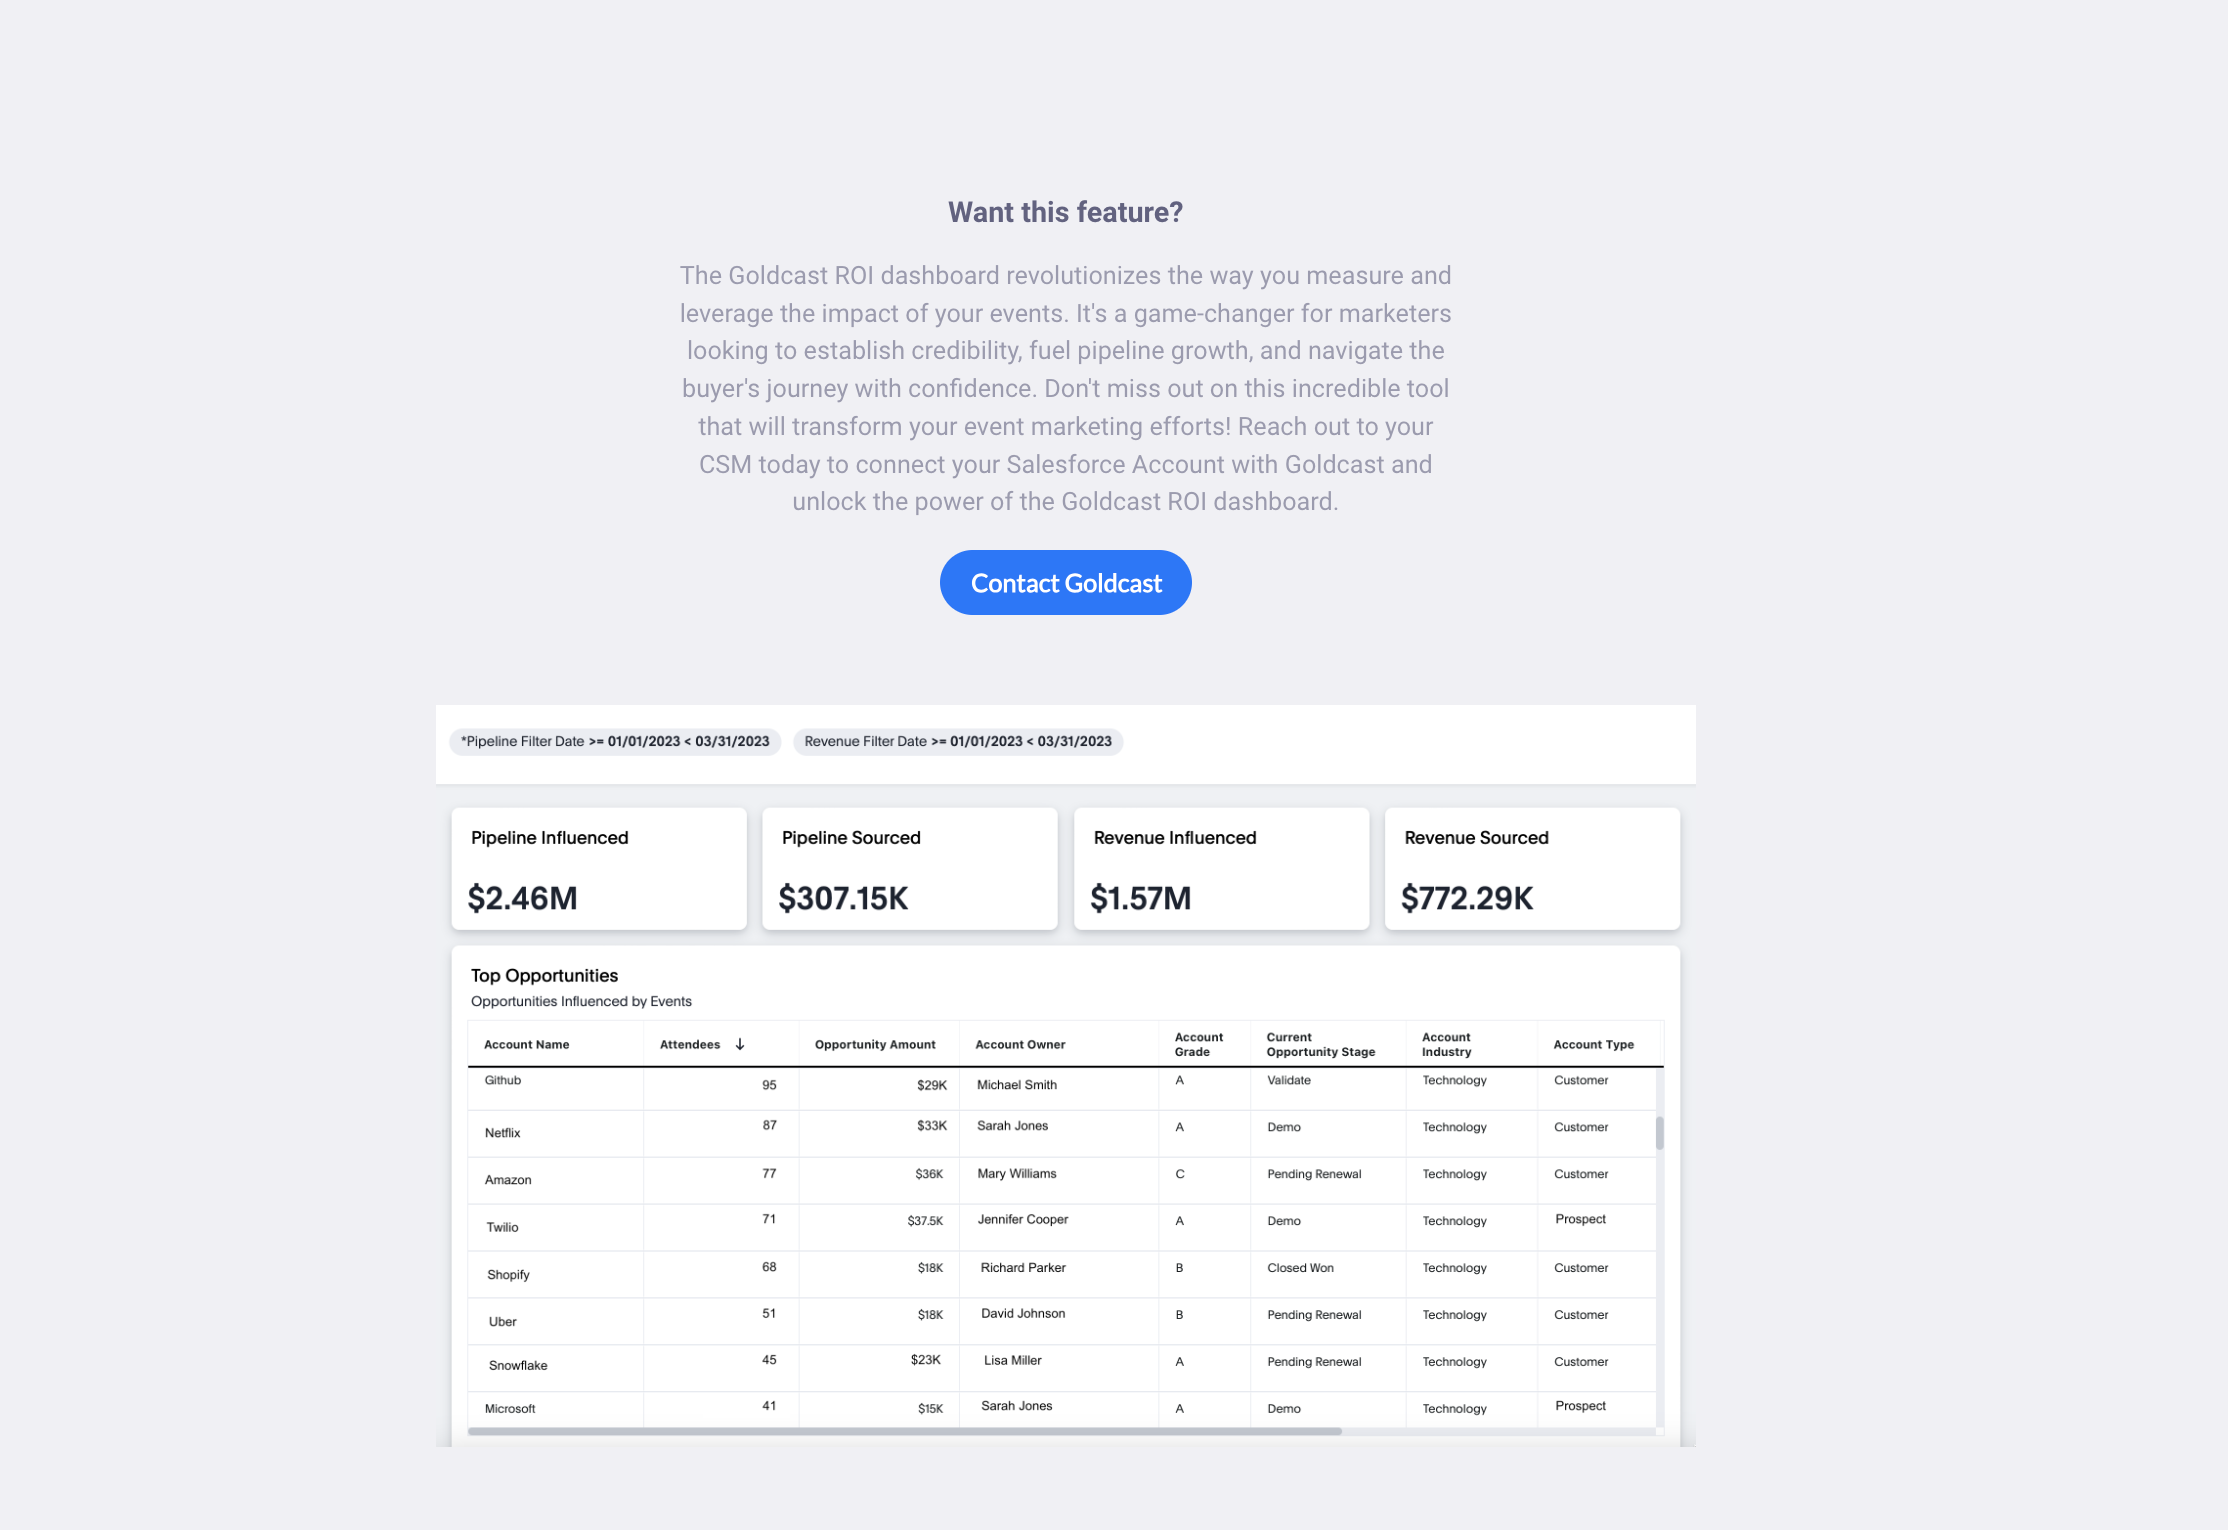
NOTE: If the ROI Dashboard is not enabled for your account, please contact your Customer Success Manager (CSM) to get this feature enabled. You can also email the Goldcast team using the Contact Goldcast button shown in the image below. For any further inquiries or assistance, kindly reach out to your Customer Success Manager (CSM) or our Support team.
Understanding ROI Reporting
ROI reporting is calculated by combining the events data in Goldcast about your customers & prospects with the Account and Opportunity data in Salesforce. We use the Pipeline Filter Date range to narrow down to only the open opportunities during that time period for the pipeline metrics, while the Revenue Filter Date range is used to determine revenue metrics through opportunities that were closed-won during that time period
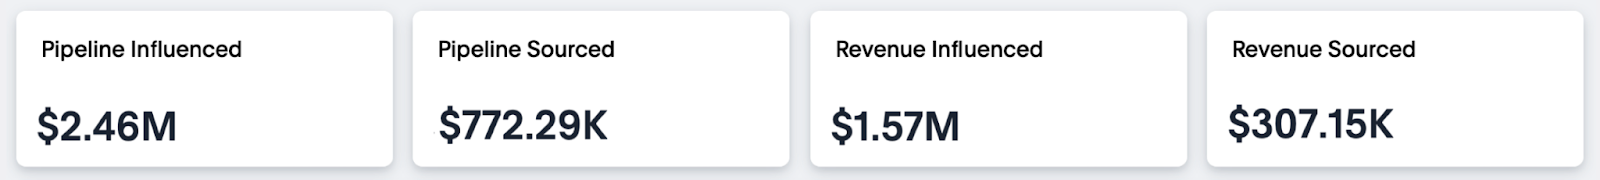
Here is how each of the top-level KPIs in this dashboard are calculated:
KPIs

-
Pipeline Influenced
This is the total pipeline your events influence through attendance of leads and contacts from your accounts which have an opportunity created and in an open state within the selected pipeline filter date range. -
Pipeline Sourced
This is the sourced pipeline from your events, which is attributed to events when one or more contacts from an account registers for an event and an opportunity is later created in Salesforce for that account within the selected pipeline filter date range. -
Revenue Influenced
This is the total amount of all opportunities which were influenced by events and also Closed-Won during the selected revenue filter date range. -
Revenue Sourced
This is the total amount of all opportunities which were sourced by events and also Closed-Won during the selected revenue filter date range.
Pipeline Opportunities Table
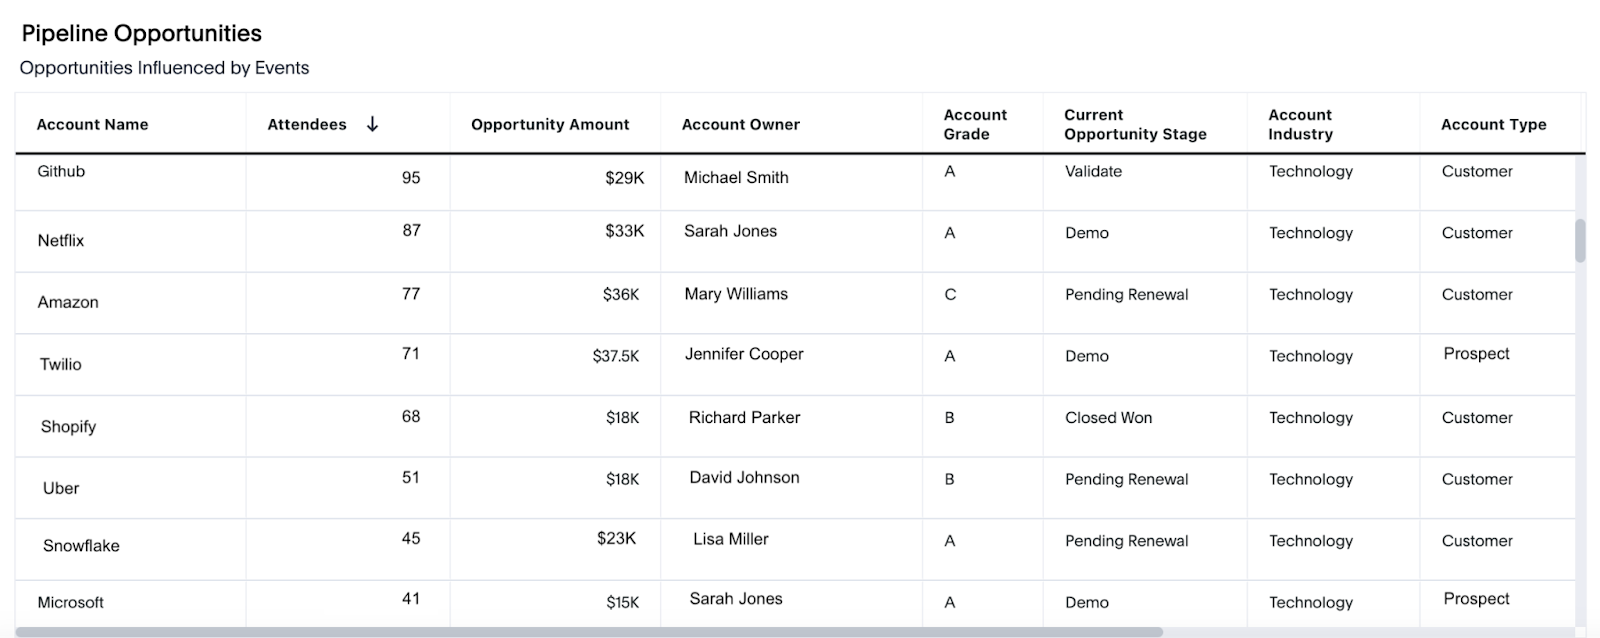
- This is the list of all opportunities which were influenced by events during the selected Pipeline filter date range.
- It provides granular information about opportunities, accounts and their attendance at your events hosted on Goldcast and who the Account Owner is from your sales team.
- The most powerful feature of this table is that you can drill down on each row in this table to find the data you are looking for in personalized post-event follow-up.
- For example, you can drill down by Event Name on an opportunity in the Validate stage to find which events this account attended. You can further drill down on each of these events by email to find out who specifically came to your event. You can send this valuable data to your sales Account Owner to follow up and help them accelerate this opportunity.
Heads up! When viewing data, KPIs and Charts are subject to Revenue and Pipeline Filters. You can use them to narrow the data within a specific time frame.
Downloading ROI Dashboard
In the top right corner, click the “more” button to access the “Download PDF” option. You can choose the format and visualizations of your PDF report from this setting.
Heads Up! If you see discrepancies in the report or any missing data, check back in some time. Data is synced every six hours with Salesforce, so it may take some time to appear in the ROI Dashboard. If the issue persists, kindly contact your Customer Success Manager (CSM) or our Support team.
FAQs
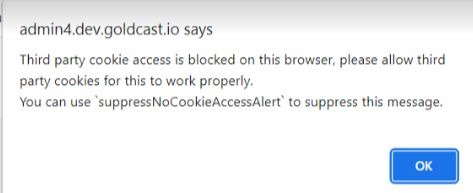
Q: When trying to access the ROI Reporting on the Goldcast platform, I’m seeing the following error. How do I resolve this error?
A: If you are on Google Chrome:
- Log into the Goldcast Platform in regular mode (Not Incognito).
- Click the lock icon beside the URL
- Click Cookies and site data.
- Turn on the Block third-party cookies toggle.
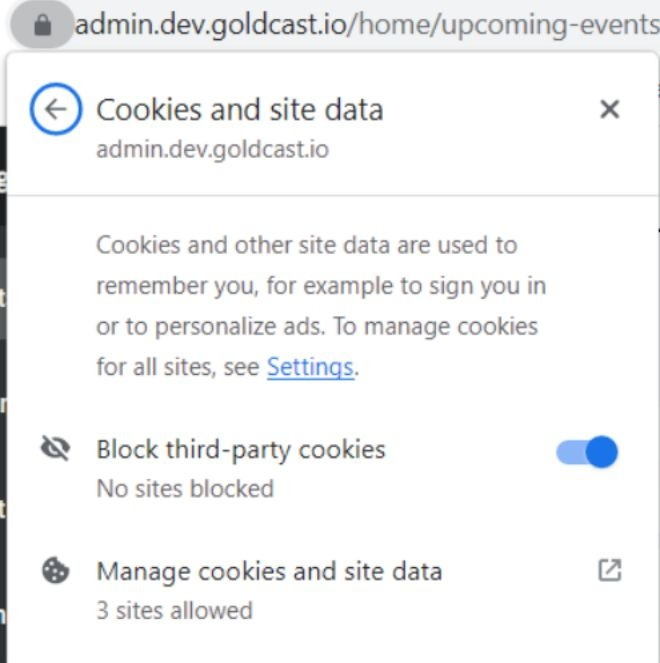
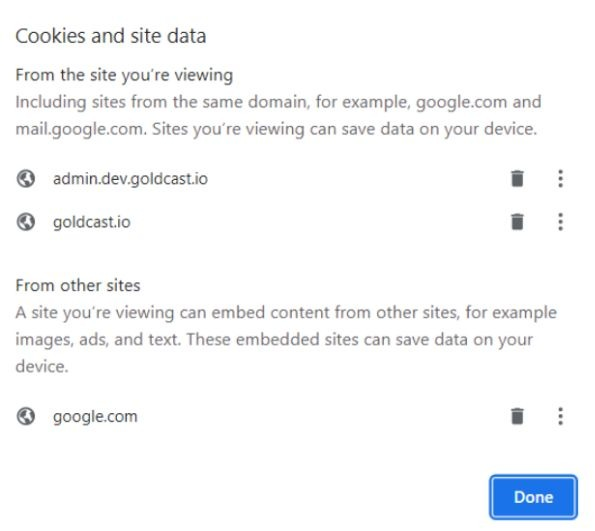
- Click Manage cookies and site data.
- Click the Delete icon to delete the site from the cookies and site data. Apply the same for all the sites in the cookies and site data.
- Click Done to save the setting.
- You will now be logged out of Goldcast platform, refresh the page to login again and navigate the ROI Report. You should see the Dashboard show up properly.
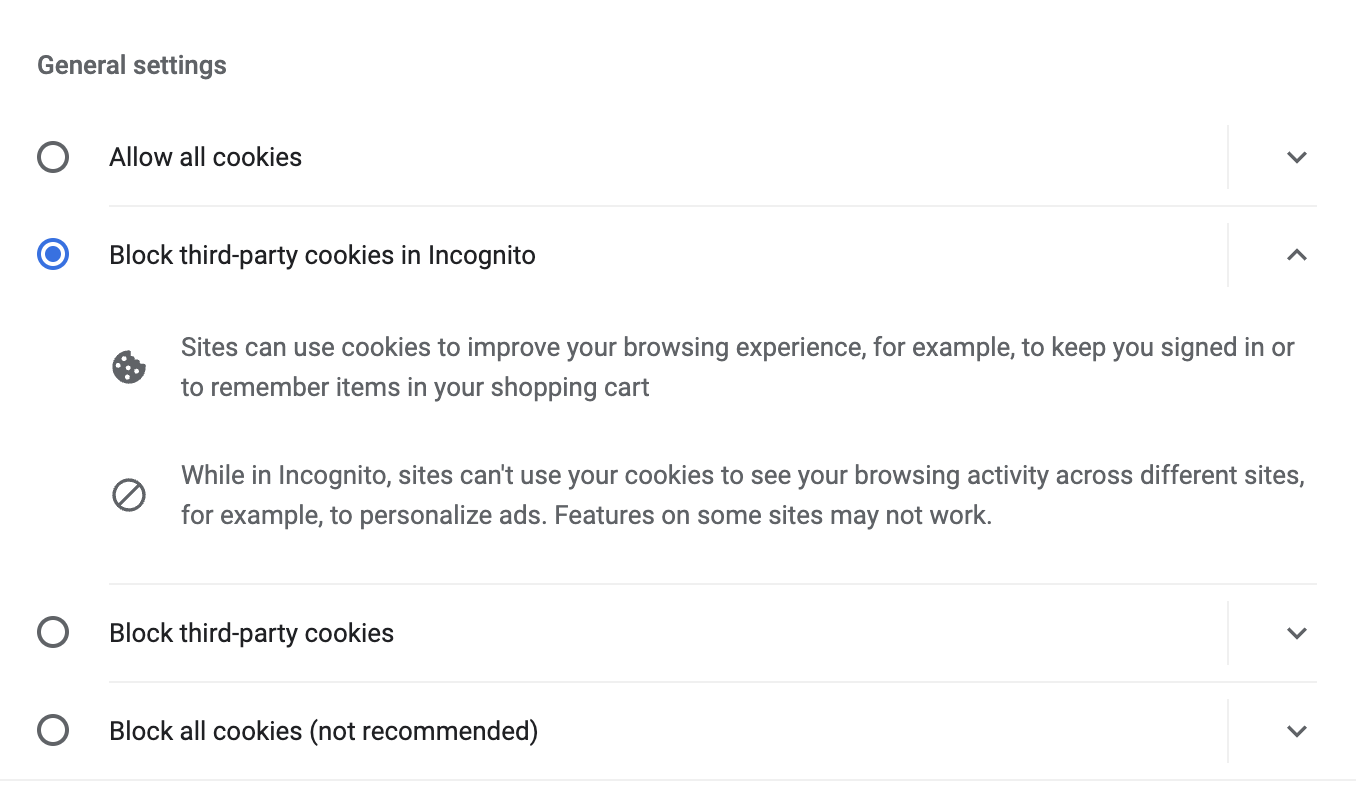
- If you want to open the Goldcast environment in Incognito or Private mode, choose the option Allow All Cookies.
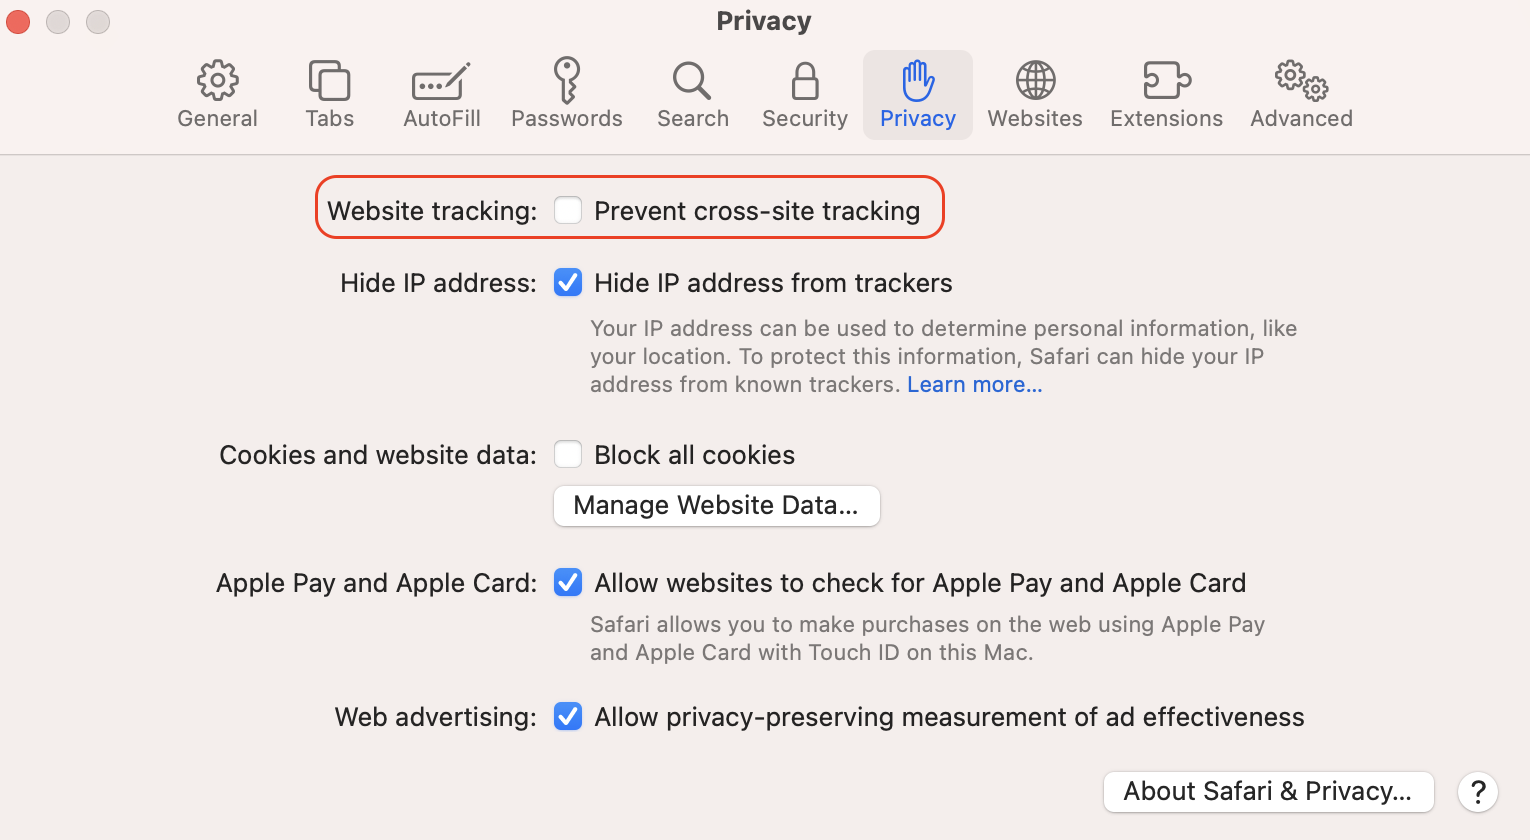
- If you are on Safari:
- Disable Prevent Cross-Site Tracking with the following options as shown in the image.
- Disable Prevent Cross-Site Tracking with the following options as shown in the image.