| Plan Availability | Starter | Pro | Premium | Enterprise |
 |
|
Add-on |  |
For customers with contracts starting March 2024 or later, feature availability is based on your pricing tier. If interested, contact your CSM or our Sales Team to discuss pricing options.
Goldcast provides two powerful reporting dashboards, cross-event and ROI reports, to give you a comprehensive view of critical event data. However, there may be instances where you need more in-depth, tailored insights. This is where our custom reporting feature comes into play.
Custom reports pull in data from across all events in your organization. You can filter, edit, and visualize these reports to align with your specific event analytics requirements. You can create and save custom reports in multiple dashboards in Studio.
Pro Tip: Our custom reports are powered by ThoughtSpot. For detailed instructions on how to view and modify your custom reports and liveboards, refer to ThoughtSpot's documentation.
How to create a custom report
- Log into Goldcast Studio and click the Reports tab. Navigate to Custom Reporting and select the Search tab.
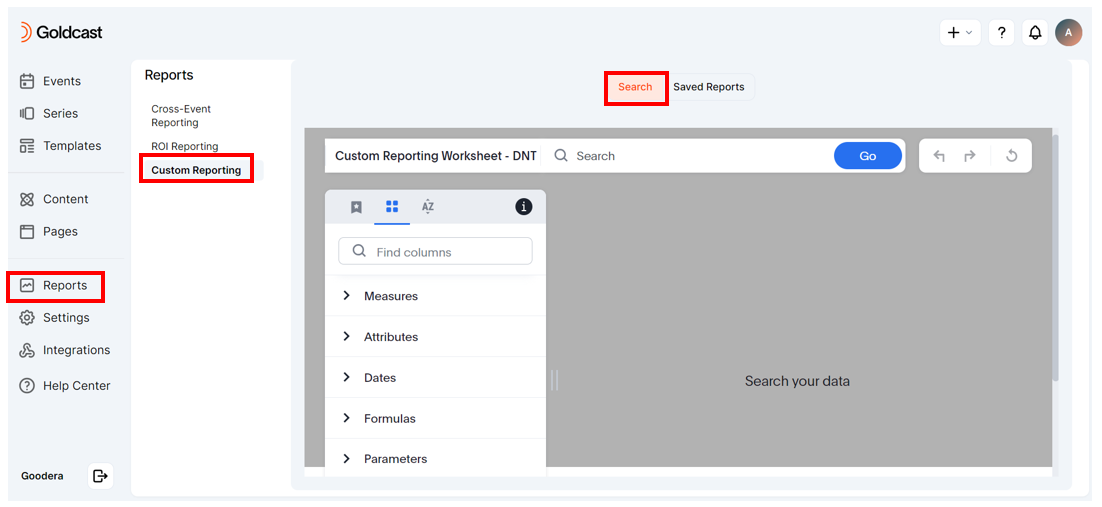
- The next step is to select and filter event data points you want to include/exclude in your custom report.
- Click the icons above to sort columns by Popularity, Names, or Category.
- Select the columns to include in the report.
- Use the filter
 icon to customize the dataset further by including or excluding specific values in each column.
 - Click the info
 icon for detailed information about a data field, such as its description, attribute, and sample values. This information will help you apply the filters.
 - Once you've selected the required columns and applied filters, click Go.
The report builder will generate a new custom report using your chosen dataset.
Heads up! Goldcast doesn’t automatically save reports. If you navigate away from this page without pinning the report to a liveboard, all changes will be lost.
Saving your report
When you finish building your report, make sure to pin it to a liveboard. Click the arrow next to the Pin button and select the liveboard to add the report. You can also create a new liveboard by clicking the +Create Liveboard option. Give your liveboard a name, and add the report to it.
Accessing previously created reports
To view a previously created custom report:
- Log into Goldcast Studio, navigate to Reports → Custom Reporting and select the Saved Reports tab.
- Click your preferred liveboard to view the custom reports saved within it.
Customizing reports
You can customize the report's visualization using the options available on the right sidebar.
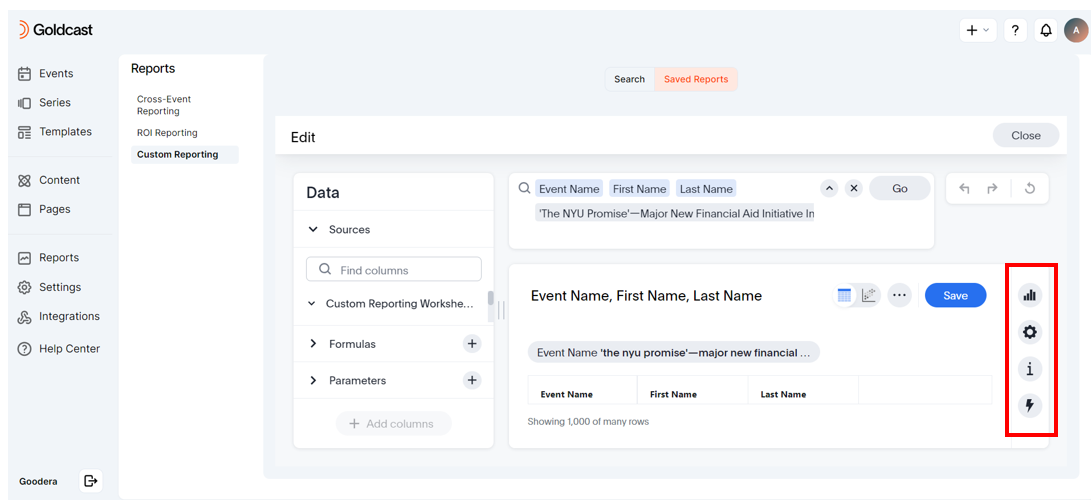
The available options include:
- Change visualization: This lets you select the chart type to display the data in your report. Note: Only chart types suitable for your report's data will be highlighted. The rest will be greyed out, and you cannot use them.
- Edit chart configuration: This lets you modify the appearance of your selected chart.
- Query details: This lets you view the query visualizer and query SQL that runs behind the scenes for your report.
- Custom Actions: Add custom actions to your report.
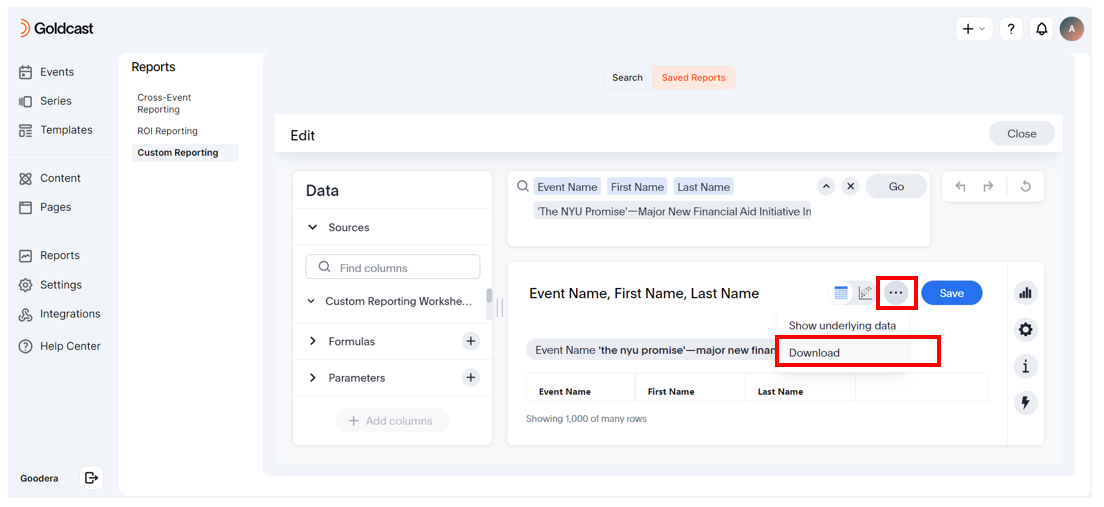
Downloading a report
You can export the data in your report as CSV or PDF. To download a report:
Click the three horizontal dots  icon in the custom reporting dashboard, select Download, and choose CSV/PDF.
Alternatively, you can download a report from the Saved Reports tab. Select the Liveboard, and click the three-dot icon next to the report to download it.
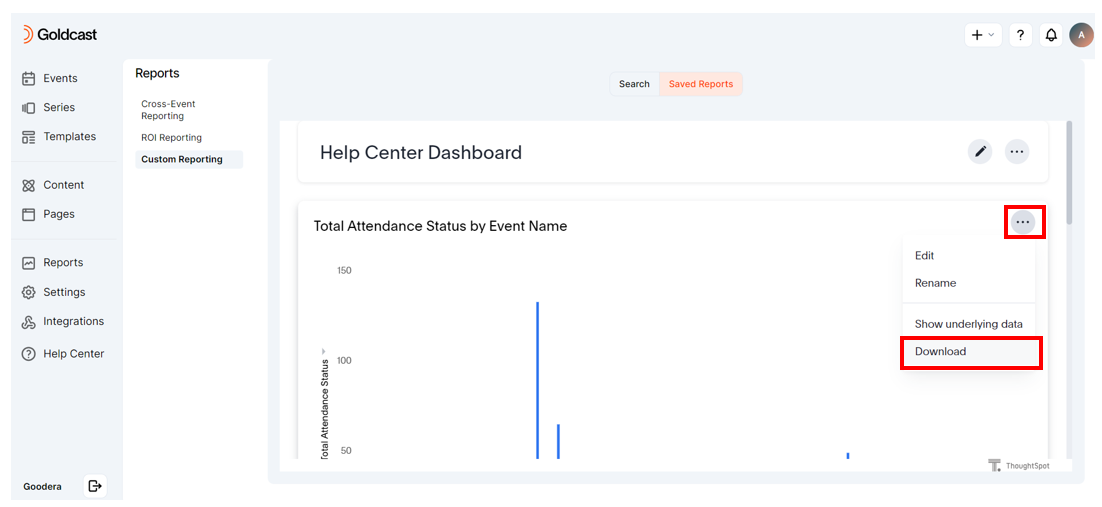
Heads Up! You can also use this menu to edit or rename an existing report.
Use Cases
This section outlines several common use cases for custom reports. Please note that these examples are not exhaustive and are just a tiny cross-section of the potential applications of our custom reporting feature.
Example #1
Track Monthly On-demand Views for an Event.
- Log into Goldcast and navigate to Reports → Custom Reporting using the left sidebar.
- Once you're on the Custom Reporting dashboard, select the following columns:
- First Name
- Last Name
- Event Name: Apply the filter to include only your required event. In this example, we are selecting the event “Goldcast Spotlight."
- Watched On-Demand Timestamp: Apply the Rolling filter and choose This Month as the timeframe.
- Click Go.
You can now see the details of all users who viewed the event in on-demand mode for the current month.

Pro Tip: Once done, you can download the data as CSV/PDF. Make sure to pin this report to your dashboard to track the on-demand views month-on-month, as and when required.
Example #2
Generate a list of all poll responses across all sessions for all events held in June 2024.
- Log into Goldcast and navigate to Reports → Custom Reporting using the left sidebar.
- Once you're on the Custom Reporting dashboard, select the following columns:
- First Name
- Last Name
- Event Name
- Event Session Name
- Event Start Time: Apply the Fixed filter and select the dates for June 2024.
- Engagement Activity Type: Apply the filter to include Poll Response.
- Poll Question
- Poll Response
- Click Go.

Example #3
Build a custom report that includes attendee email addresses, first and last names, and sessions attended.
- Log into Goldcast and navigate to Reports → Custom Reporting using the left sidebar.
- Once you're on the Custom Reporting dashboard, select the following columns:
- First Name
- Last Name
- Event Name
- Event Session Name
- Click Go.
