Webinar Analytics Dashboard
Follow these steps to view the analytics dashboard for webinars, powered by Smart Event Technology:
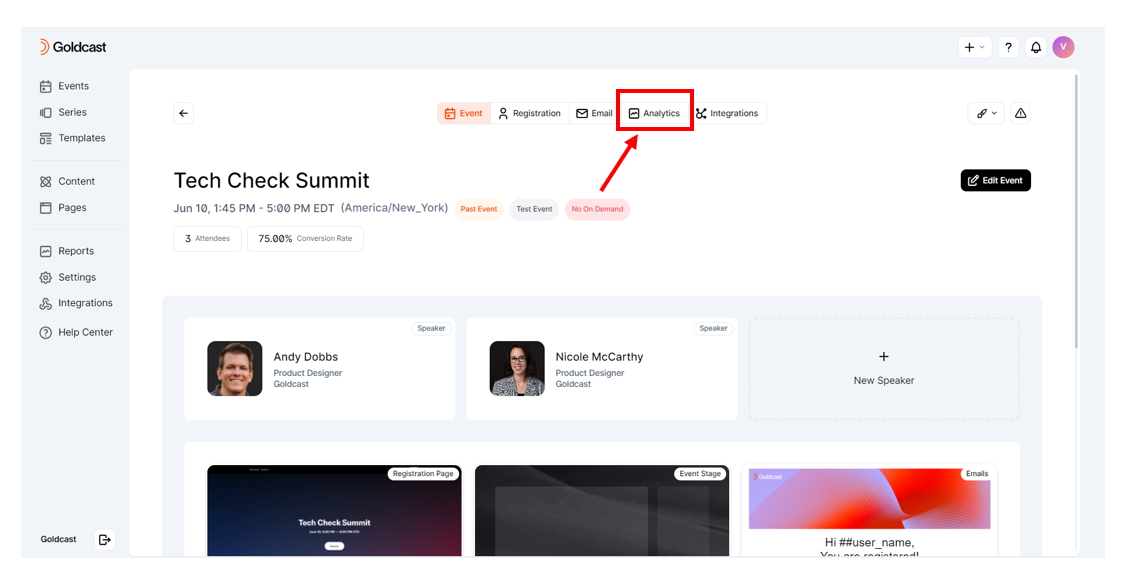
- Log into Goldcast Studio and open your preferred webinar.
- On the event dashboard, click the Analytics tab at the center.
- The Analytics tab displays the following dashboards:
- Event Summary: Overview of the critical metrics related to your webinar’s performance and attendee engagement.
- Pre-Event: Gain access to data such as registration, daily registration count, etc. This dashboard is also available post-event to get a complete overview of the registration timeline.
- Engagement: Comprehensive overview of all webinar engagement data.
- Session: It provides KPIs, attendee activity, and survey results for your webinar.
- Emails: Track information about your emails, such as delivery rates, links clicked, etc.
- Clips: Track the performance of the clips on your on-demand page (if any). This dashboard is populated only after the webinar goes into on-demand mode.
Pro Tip: For detailed information on the metrics and KPIs in these dashboards, refer to Reporting & Analytics.
On-demand Analytics
You can track on-demand data via the Summary and Engagement dashboards.
Via the Summary Dashboard
Once the webinar is on-demand, the Summary dashboard will begin reflecting on-demand metrics such as:
-
On-Demand Attendees: This is further categorized into:
- Identified: This metric reflects the total number of attendees who submitted their emails and watched the webinar either only on-demand or both live & on-demand.
- Anonymous: Total number of attendees who watched the webinar without submitting their emails. This metric is applicable only when your event is available in on-demand ungated mode.
-
Average Time Spent: Just like the on-demand attendees metric, this is also further categorized into:
- Identified: The average time spent (in minutes) by users who have submitted their emails viewing on-demand content.
- Anonymous: The average time spent (in minutes) by anonymous users in viewing on-demand content. Applicable only when the event is available in on-demand ungated mode.
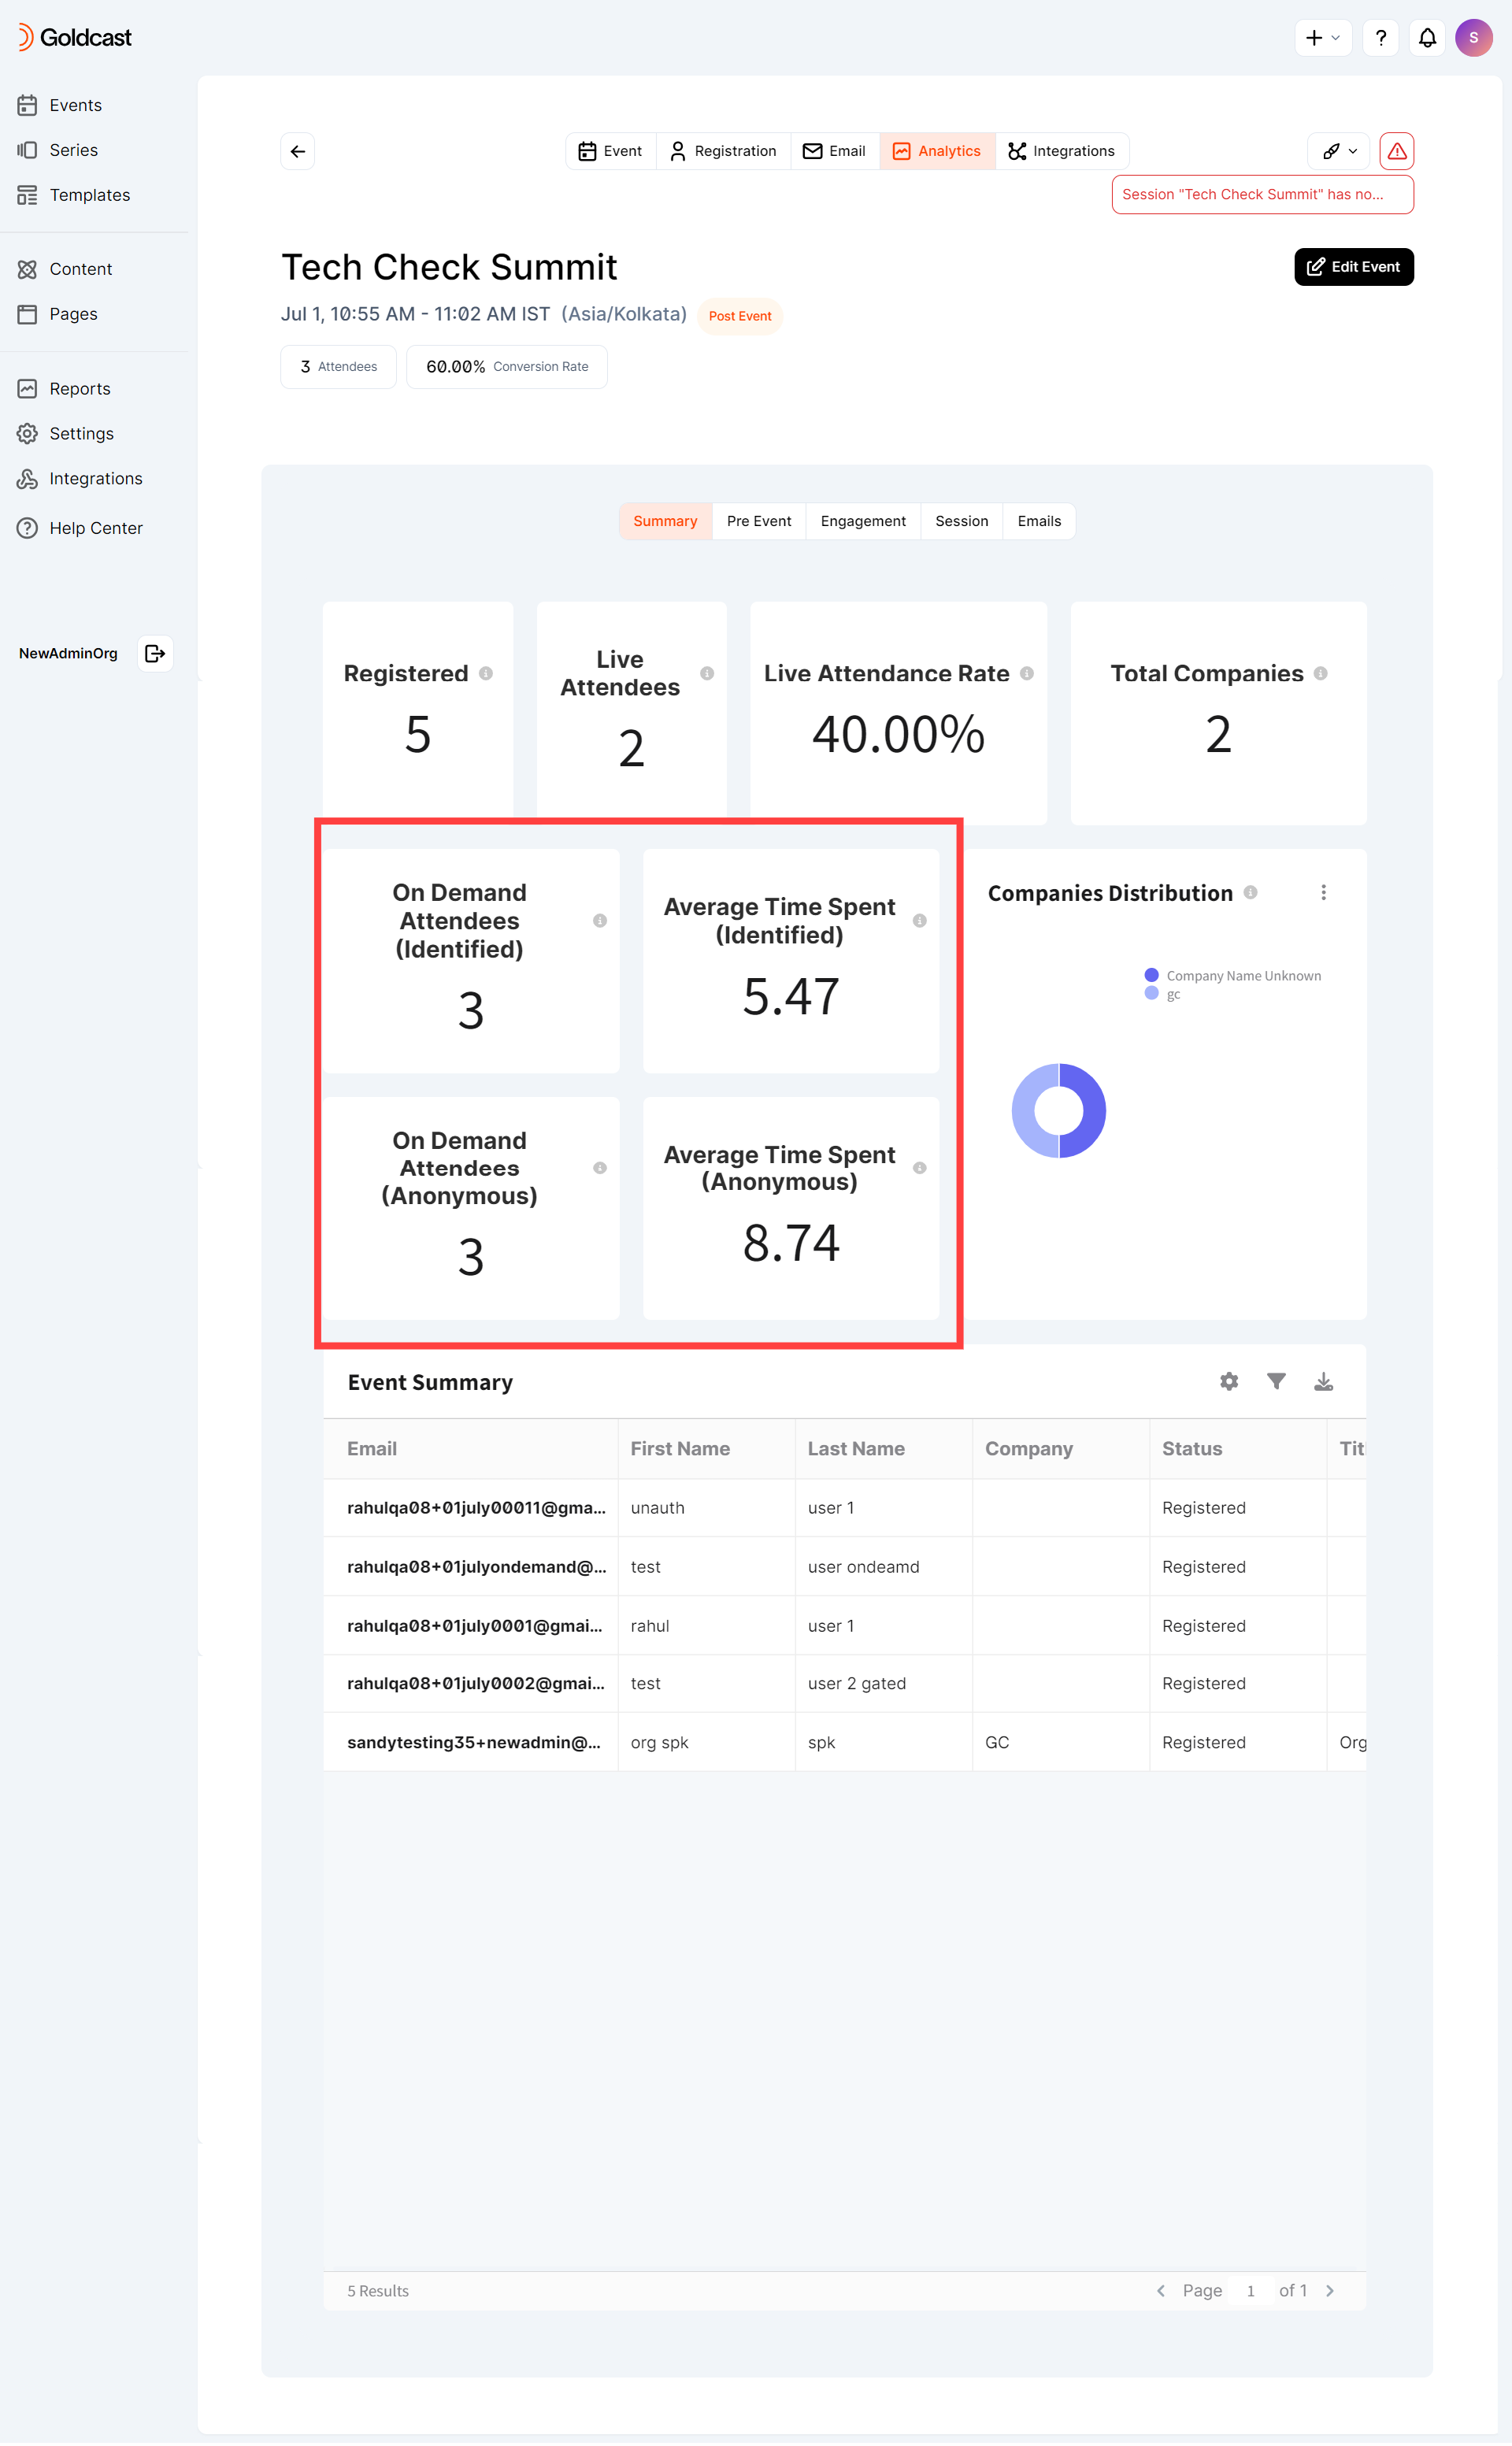
Heads Up! The Event Summary table at the bottom of the page only includes information on users who have submitted their emails. It doesn't include anonymous data.
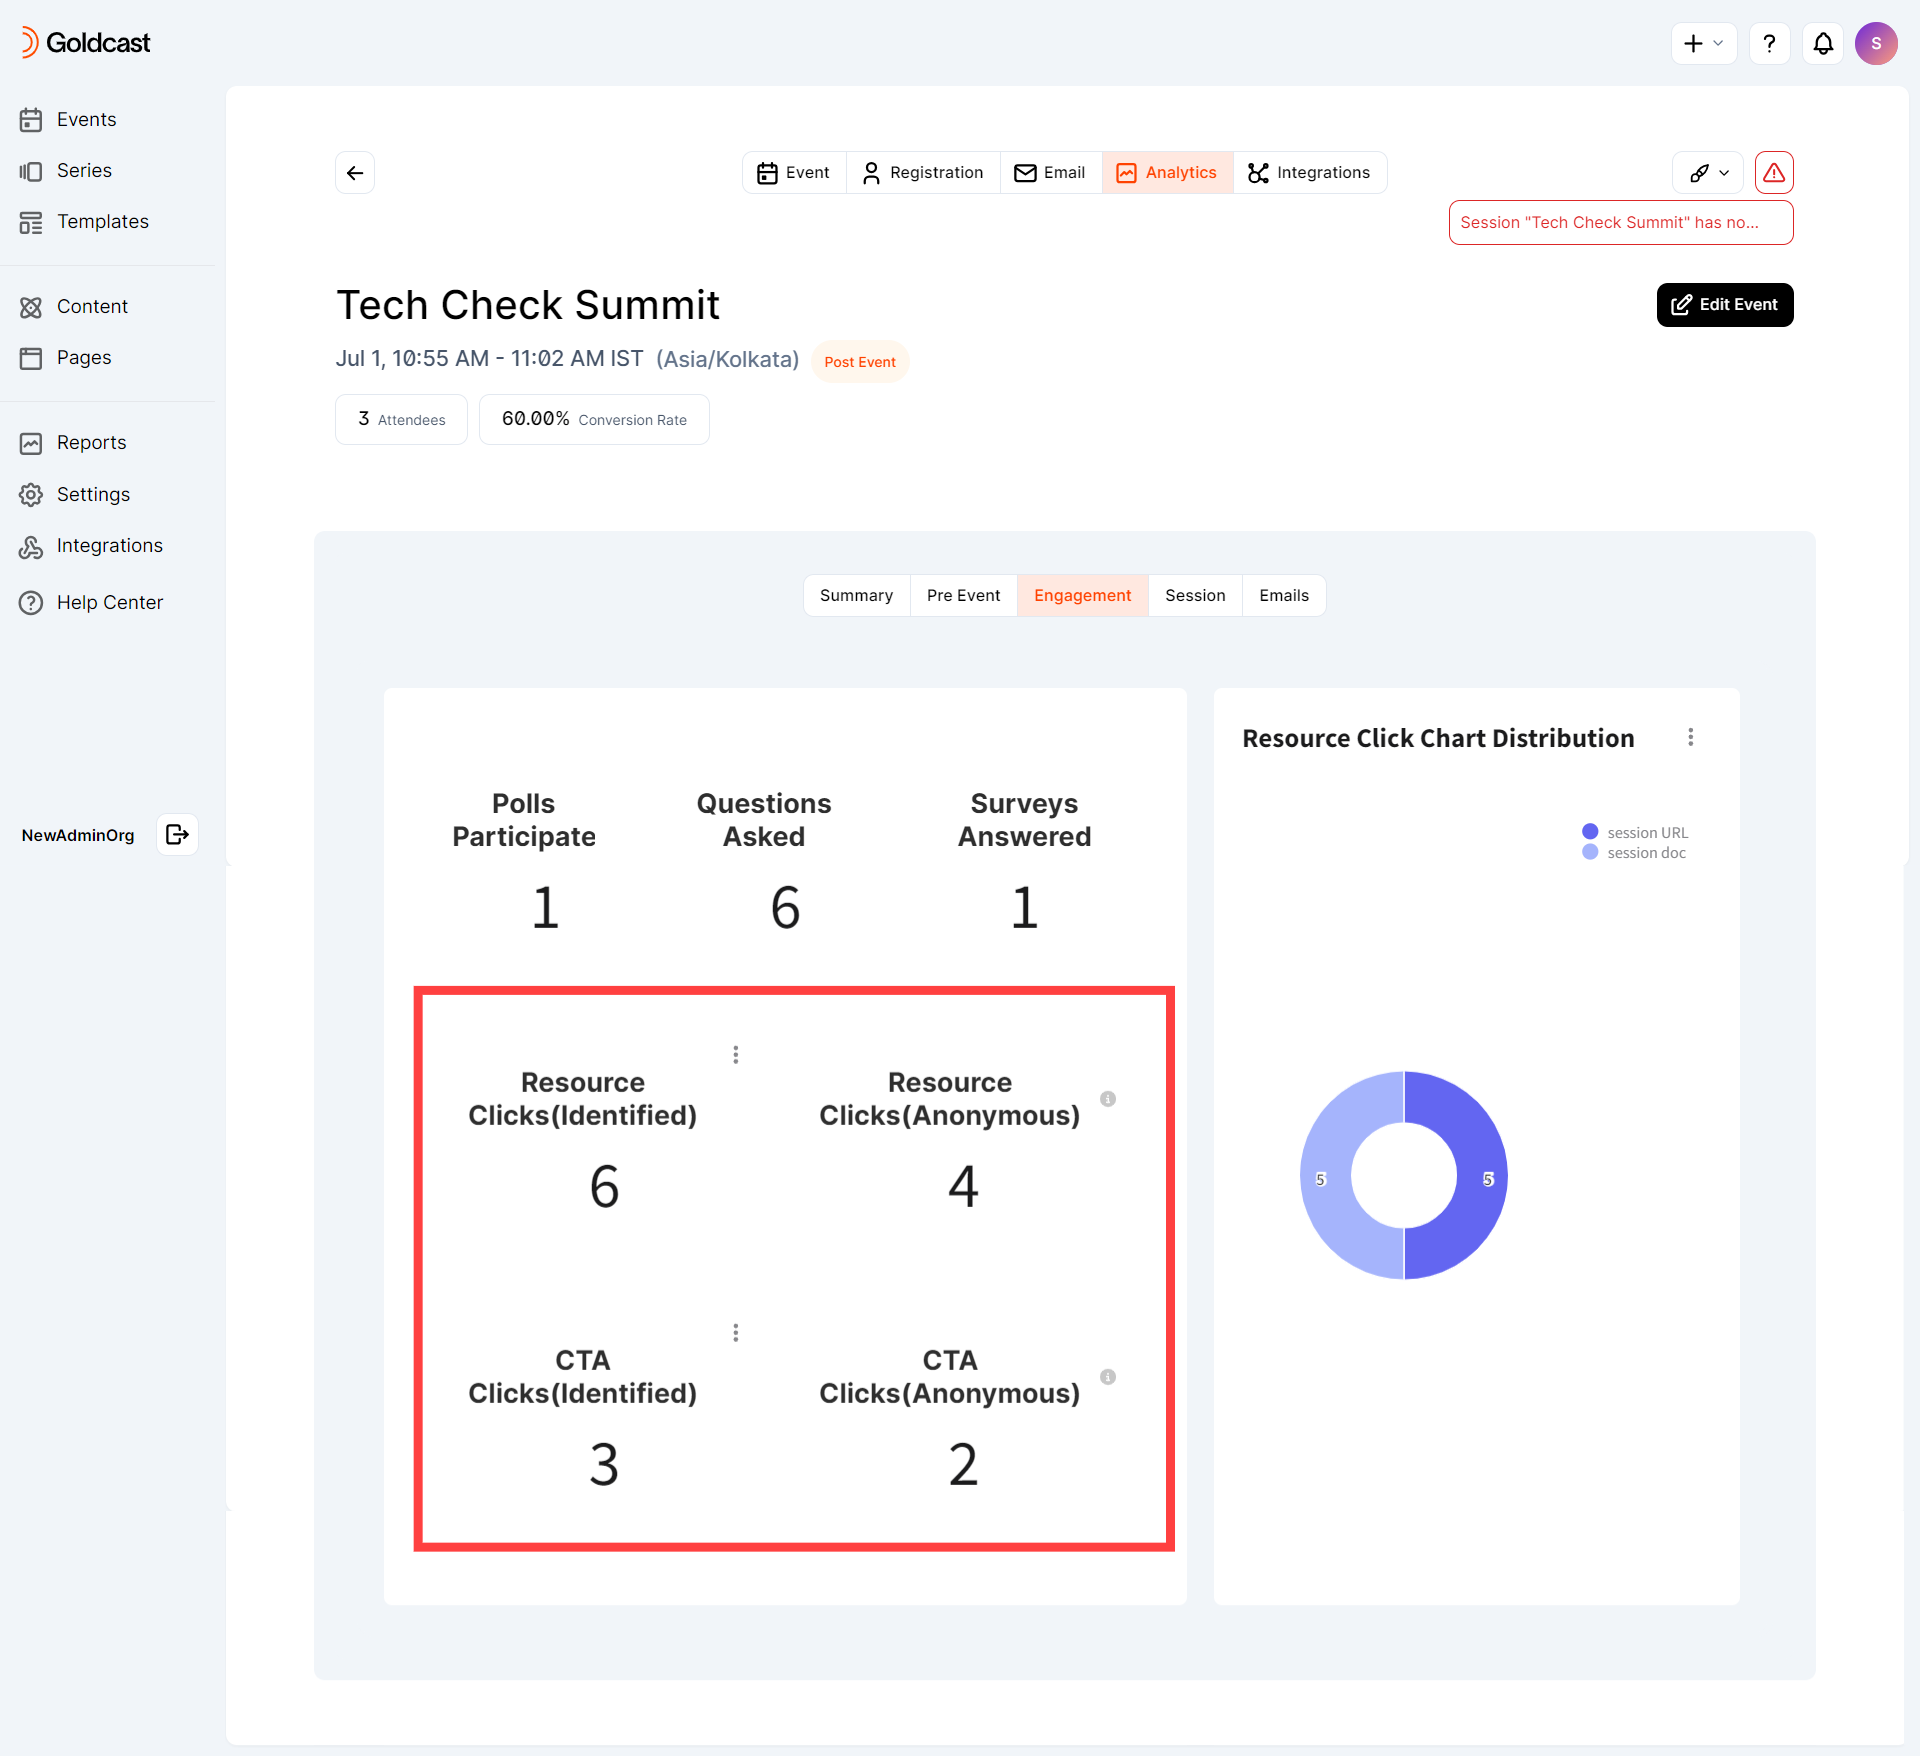
Via the Engagement Dashboard
Once the webinar is on-demand, the engagement dashboard will begin to reflect on-demand data, such as:
- Resource Clicks (Identified): Number of times resources are downloaded by users who have submitted their emails.
- Resource Clicks (Anonymous): Total number of times resources are downloaded by anonymous users.
- CTA Clicks (Identified): Total number of CTA clicks made by users who have submitted their emails.
- CTA Clicks (Anonymous): Total number of CTA clicks by anonymous users.
Pro Tips
Check out these tips for maximizing your use of the Analytics tab.
Tip #1: Use the tooltip
Explore each metric in detail by hovering over the info icon ![]() to uncover information on what it captures.
to uncover information on what it captures.
Tip #2: Drill down into each metric
Click the three vertical dots icon (wherever available) to expose the underlying data. Additionally, you can use the filter icon to narrow down the data further.
Tip #3: Export data
Click the download icon to export data as a CSV or XLSX file.
