| Plan Availability | Starter | Pro | Premium | Enterprise |
 |
|
|
|
For customers with contracts starting March 2024 or later, feature availability is based on your pricing tier. If interested, contact your CSM or our Sales Team to discuss pricing options.
Introduction
The Event Summary dashboard displays your event's most prominent metrics, along with key data that you can quickly download and share with stakeholders. As an event organizer, you can utilize this dashboard to gain valuable insights into the event's performance and access the most frequently requested data, including registration and attendee lists.
How to access the event summary dashboard
For Events
- Log into Goldcast Studio and use the Events tab to open your preferred event.
- From the event dashboard, click Analytics → Event Summary using the left sidebar. The Event Summary dashboard is the first one in the Analytics tab. Other tabs in this section, such as Pre Event, Engagement, Booth, Sessions, Rooms, and Emails, provide more granular event data.

For Webinars
- Log into Goldcast Studio and use the Events tab to open your preferred webinar.
- From the webinar dashboard, click the Analytics tab at the top.
- Next, navigate to the Summary dashboard. The Summary dashboard is the first one in the Analytics tab. Other tabs in this section, such as Pre-event, Engagement, Booth, Sessions, and Rooms, provide more granular event data.

Note: The format of the Event Summary dashboard changes according to the event state. If the event has not yet taken place, the Event Summary view will highlight registration information. Once the event starts, the Summary view will highlight attendee data through KPIs, charts, and tables.
Using the dashboard
Share Event Summary Analytics
When you click the Share button on your Event Summary, you’ll have several options to share it with others:

- Share to web – Generate a secure, password-protected link so viewers can open your Event Summary in a browser. The following are the steps to generate a link:
- Enter a password of your choice and click Set. Once saved, a shareable Event Summary link will be generated.

- Click Copy to copy the link and share it with viewers.

- (Optional) Turn on the toggle Allow viewers to interact with filters if you want viewers to adjust filters within the Event Summary.
- Download – Download your Event Summary for offline sharing or record-keeping. Available formats are PDF and Image.

- Send to email – Share your Event Summary directly with recipients through email. Follow the steps below:

- Choose the desired file format (PDF or Image).
- Enter the recipient's email address.
- Click Send email.
Share Metric-level Summary
You can drill down into the visualization to get more insights into data, such as companies that have registered for your event.
- Click the three vertical dots icon and click download to export the data in this dashboard as PDF or CSV.
- Click the three vertical dots icon and click Send to email to share the data over email.

- Use the settings and filter icons on the data table to customize the data displayed according to your requirements.

Data and KPIs
Heads up! All the Timestamp in the dashboards are in UTC.
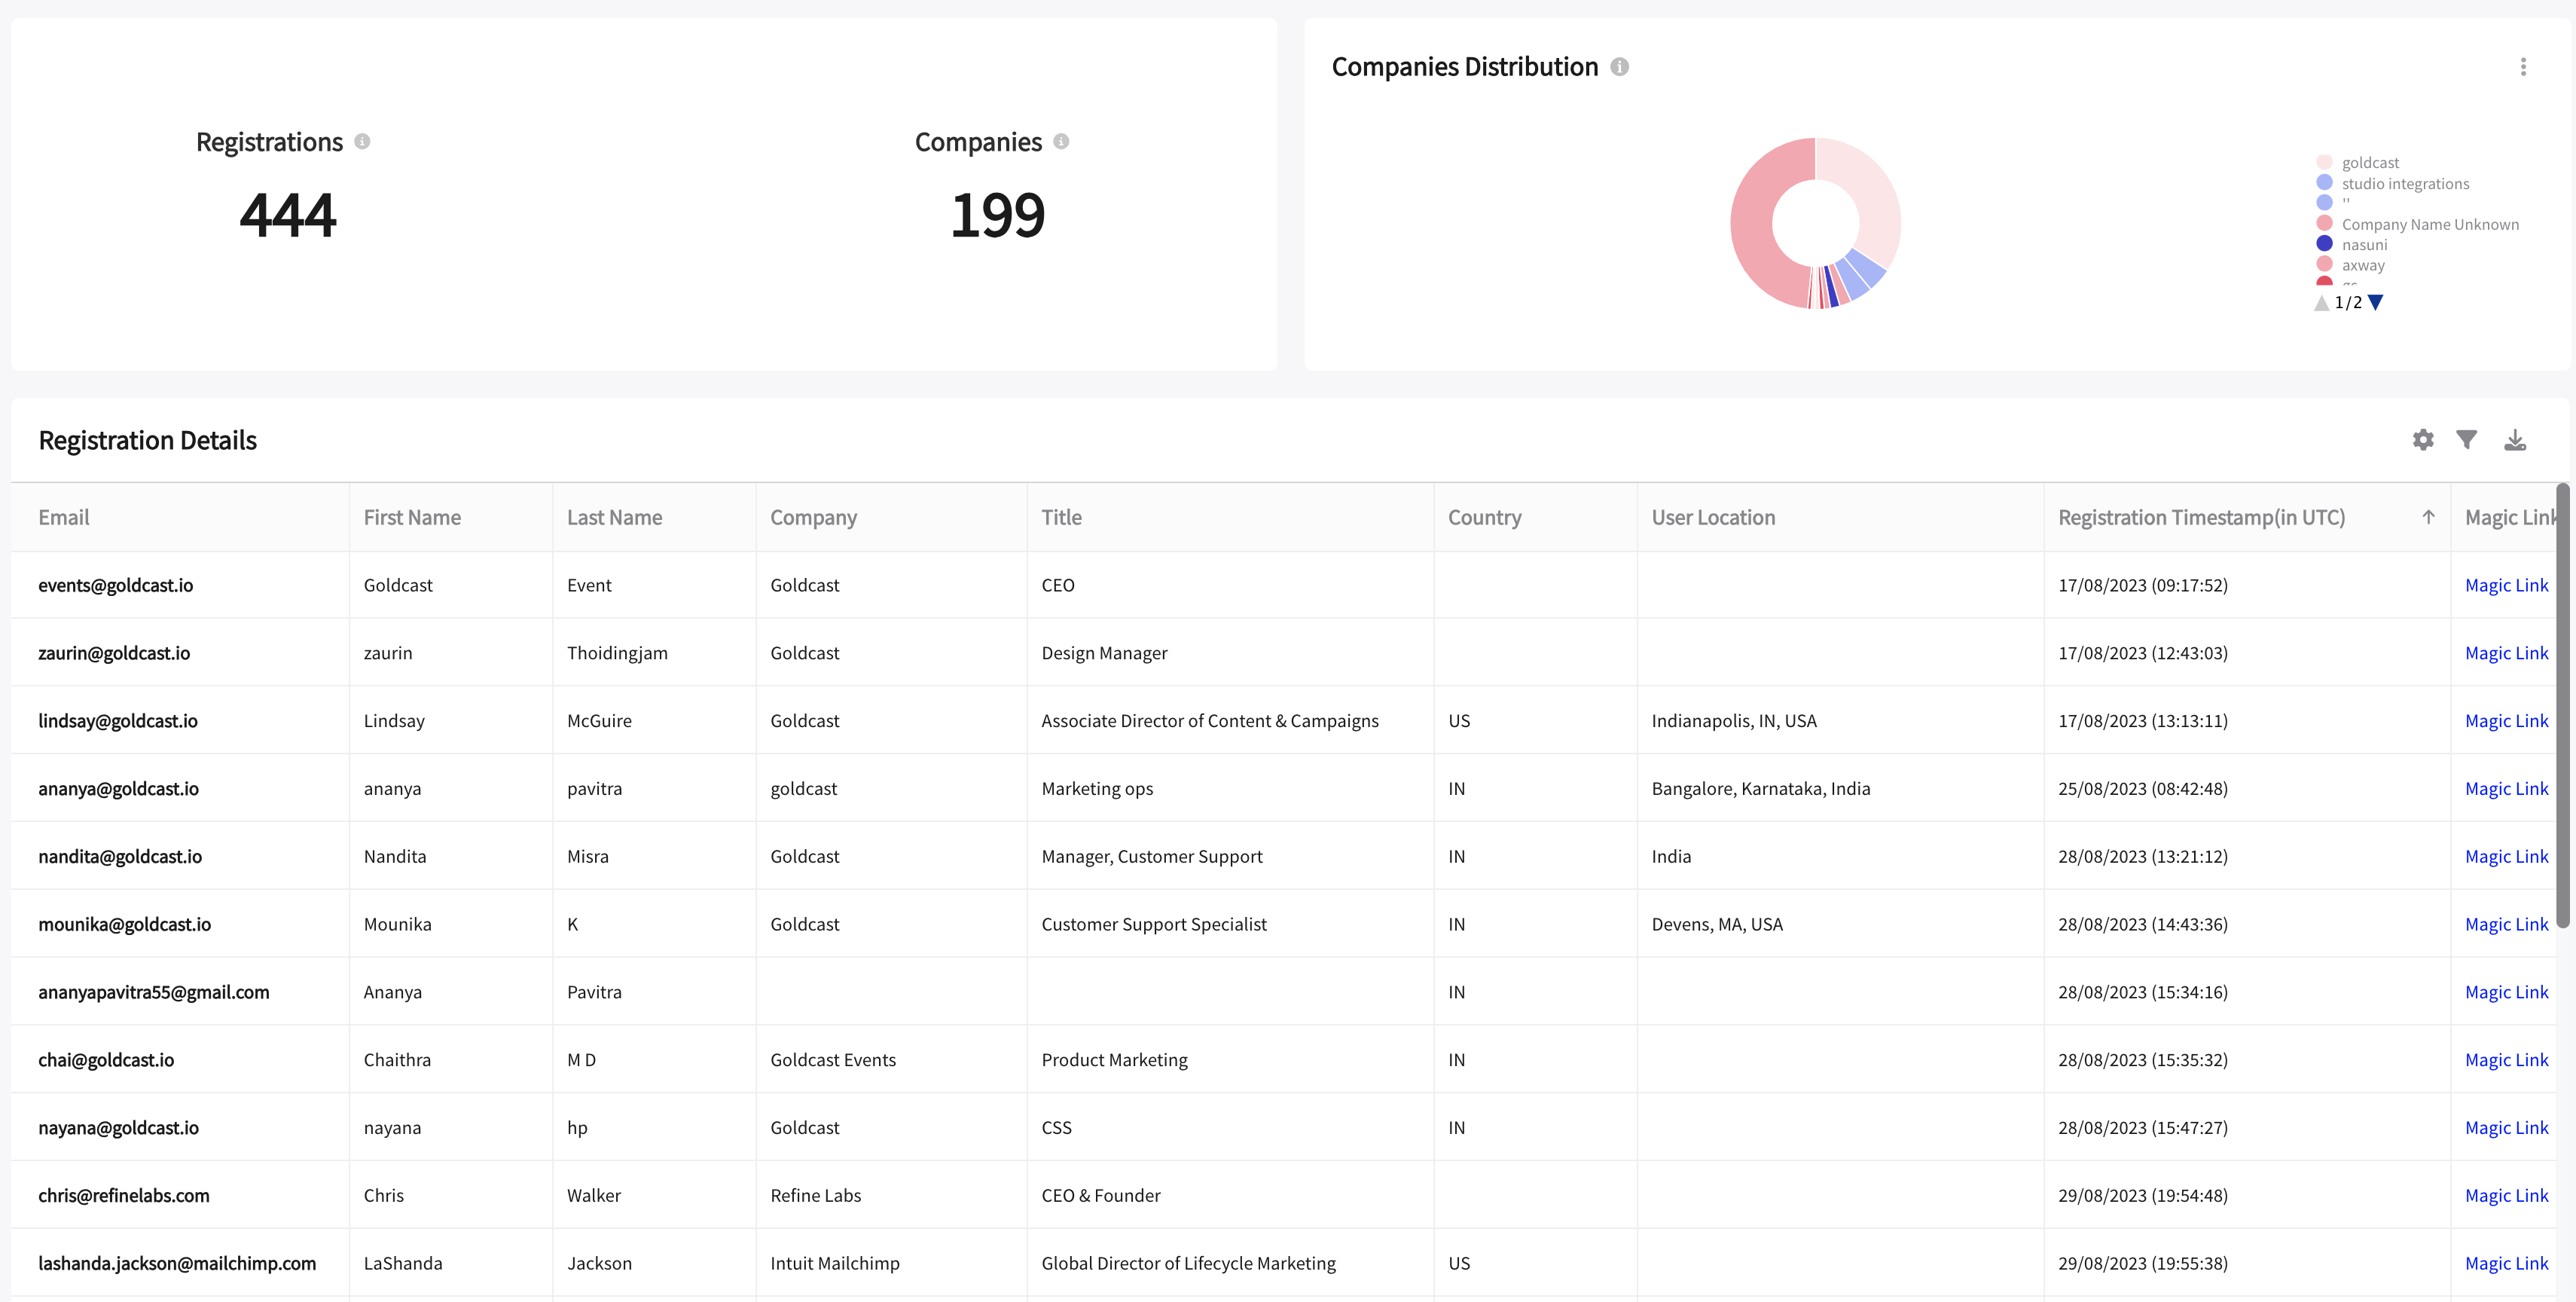
Registrants Data
- Registrations: Total registrations at your event.
-
Companies: Represents the total distinct number of companies that event registrants belong to. This is derived from the company data captured from your registration forms.

-
Companies Distribution: This pie chart visually represents the distribution of the number of registrants per distinct company. You can hover over the chart to get numbers related to each section for companies in the chart. This chart displays the companies from which users have registered for the event and the unknown companies with the count.

- Registration Details: This table provides in-depth details about event registrants. It displays information such as First Name, Last Name, Email, Company, and Title. If your Goldcast registration forms have extra fields, such as UTMs, these columns will be appended to the same table. You can also access the Magic Link corresponding to each registrant in the dashboard and export it as required.
Attendee Data
- Registered: Total registrations at your event.
- Live Attendees: The total number of attendees who attended the event live, including those who attended live and watched it on-demand.
- Attendance Rate: This percentage represents live attendees vs total registrations for your event.
- Companies: Represents the total distinct number of companies that event registrants belong to. This is derived from the company data captured from your registration forms.
-
On-Demand Attendees: This represents the total number of on-demand attendees, including those who attended the event live and watched it on-demand.

-
Attendance Distribution: This represents the distribution of Attendance vs Registrations as a pie chart. You can hover over the chart to get detailed numbers. This chart displays four parameters:
- Live(Only)
- On-Demand(Only)
- Both Live and On Demand
-
Did Not Attended

-
Companies Distribution: This represents the distribution of the number of registrants per distinct company as a pie chart. You can hover over the chart to get detailed numbers related to each section for companies in the chart. This chart displays the companies where users have registered for the event and the unknown companies with the count.

-
Average Time Spent Per Session - It shows the average time attendees spend at each session in the event, giving you insight into which session drew the most traffic.

Heads up! The Time Spent Per Session metric and other values in the Attendee chart will be available for viewing two hours after the event ends.
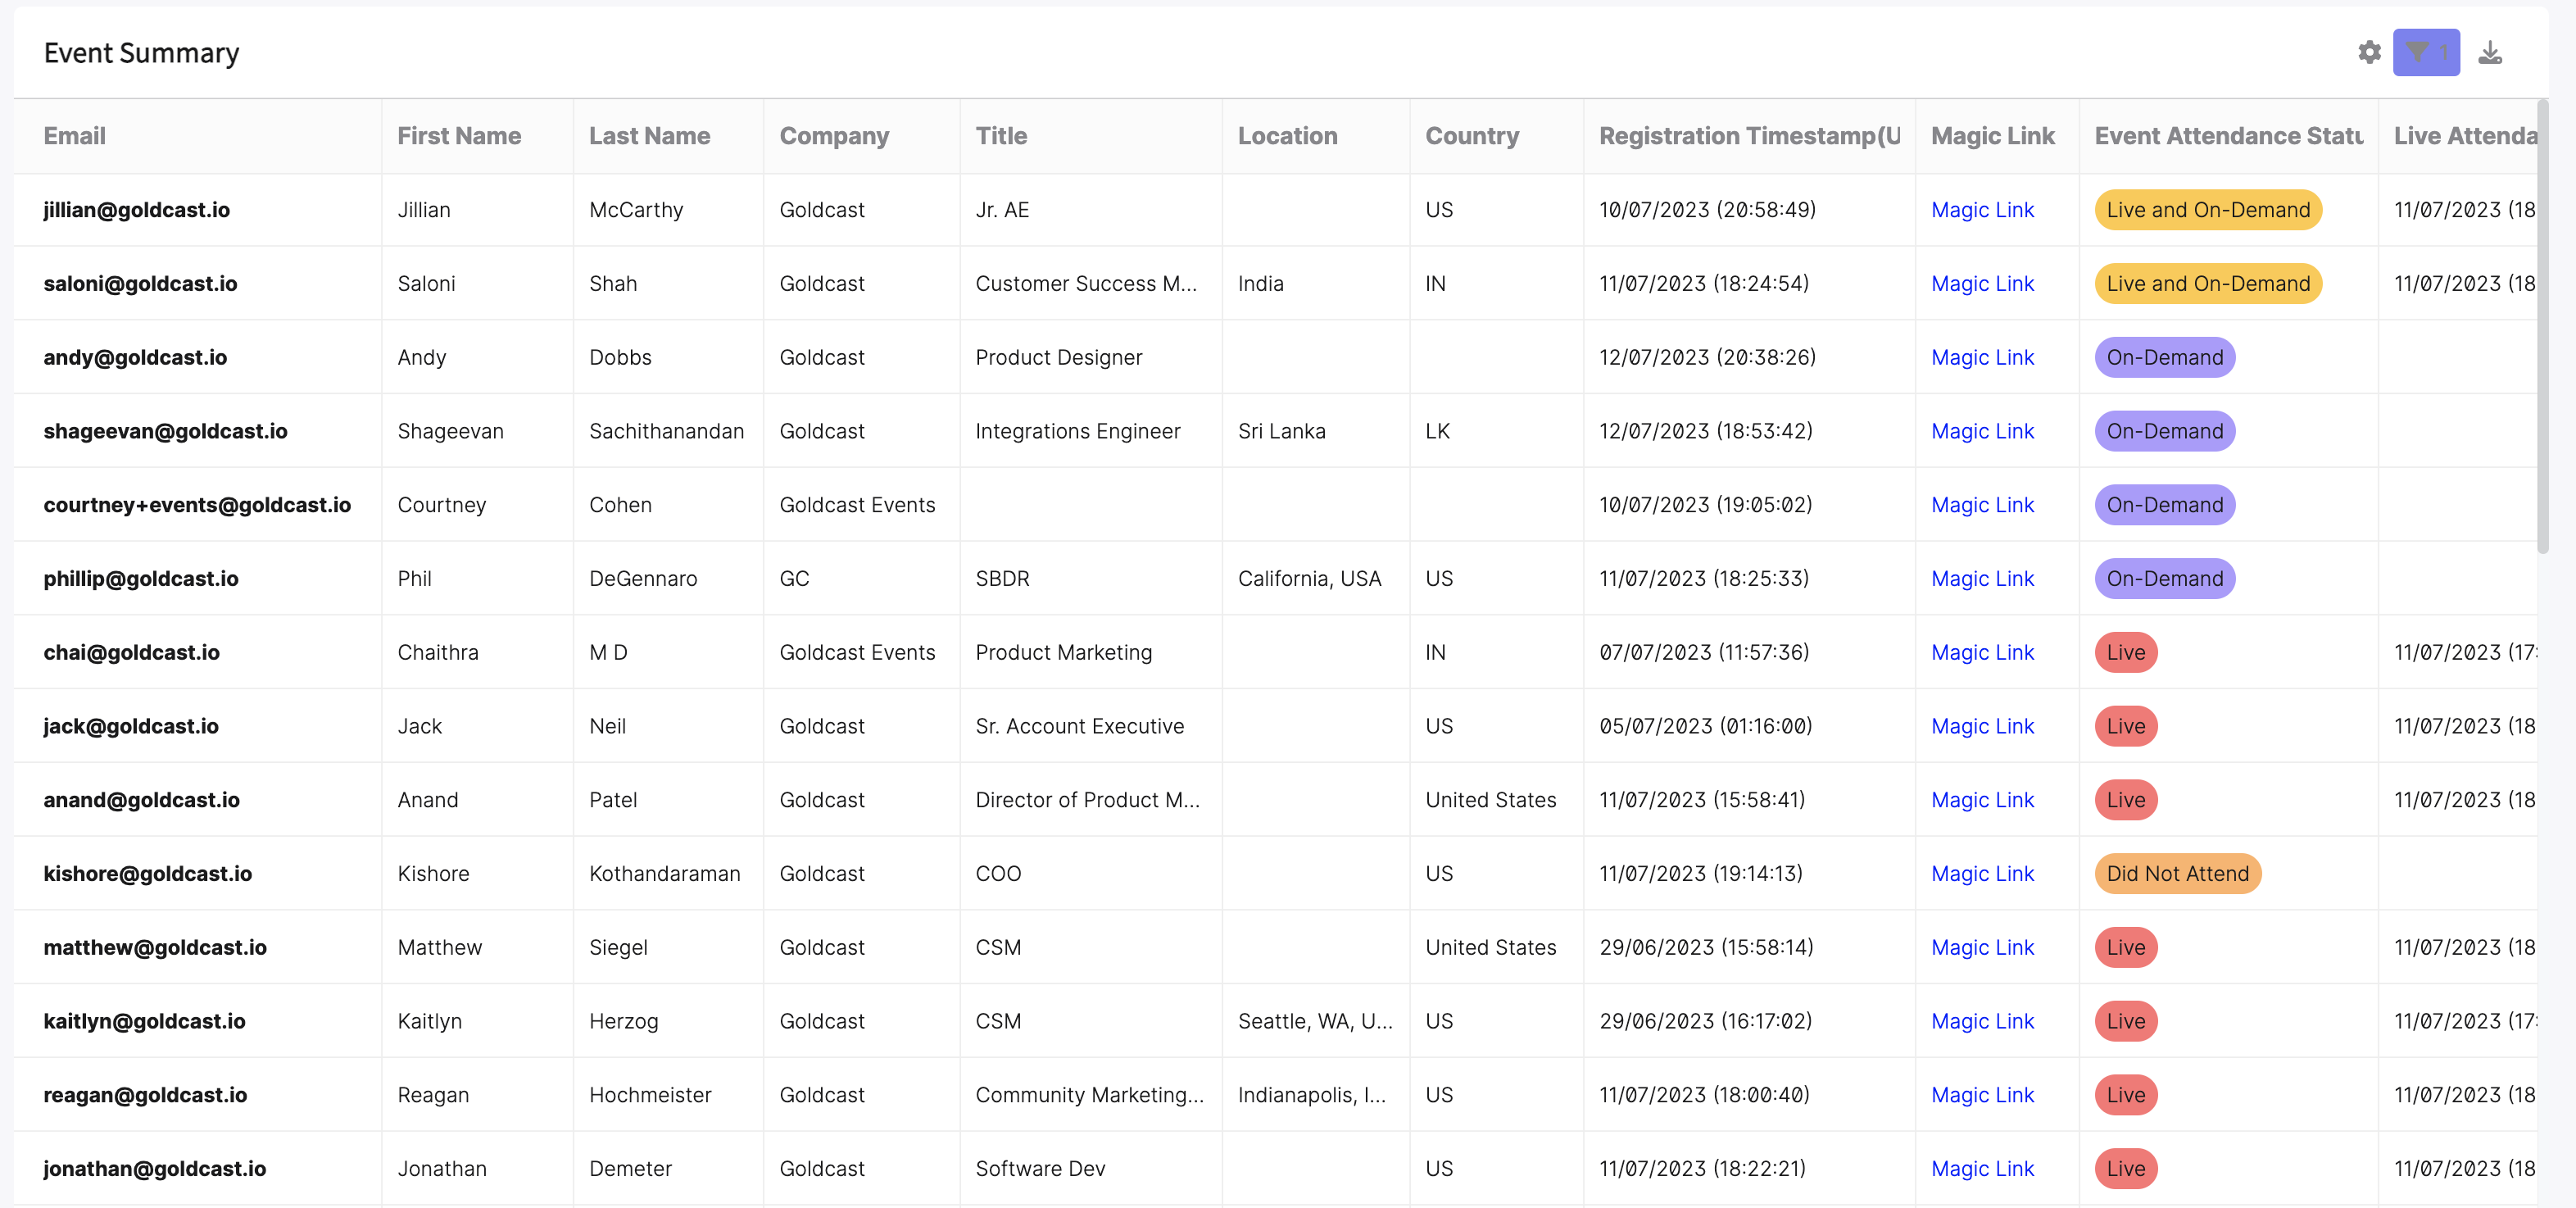
Event Summary Table
This table gives you granular details on attendee registration and engagement data. Columns are dynamic and based on the type of activities captured during the event. Use the settings and filter icons to configure which columns to display. Here is a list of data columns displayed in this table:
- First Name, Last Name, Email, Company, Location, Country, Attendance Mode, Timestamps for Attendance (Virtual/In-Person/On-Demand), and Time Spent per attendee.
- Engagement data per attendee, like Calls to Action clicked, Number of Questions asked and Polls Answered, and the number of chat messages collectively in an event.
- It also includes dynamic information related to extra fields added to your Goldcast Registration form, like UTM Parameters, Dietary Restriction, Data Share Consent, Country, Age, etc.
- You can also access the Magic Link corresponding to each registrant in the dashboard and export it as required.
Pro Tip: Filter the Event Attendance Status to get glandular data on No Shows, Live Only Attendees, On Demand viewers and those who participated both Live and On-Demand.
Event No Shows
This table contains primary details of the registrants who did not attend the event. The columns displayed here are First Name, Last Name, Email, Title, Company, and Registered Timestamp (UTC). Columns are dynamic and based on the type of activities captured during the event.
