| Plan Availability | Starter | Pro | Premium | Enterprise |
 |
 |
|
|
For customers with contracts starting March 2024 or later, feature availability is based on your pricing tier. If interested, contact your CSM or our Sales Team to discuss pricing options.
Overview
Reports is a centralized workspace for analyzing the performance of all your past events hosted on Goldcast. With Reports, you can quickly gain valuable insights into the performance of all your past events, helping you identify areas for improvement and make data-driven decisions for your future events.
With cross-event reporting, you can:
- Track attendee engagement across multiple events, measure the effectiveness of marketing channels and identify trends across various events.
- Gain insights into what content resonates with attendees, the types of events they attend, and the speakers they prefer.
- Find out which prospects and customers are active participants in your events so you can follow up with them for sales or upsell opportunities.
How to view the cross-event report
- Log in to Goldcast Studio with your credentials.
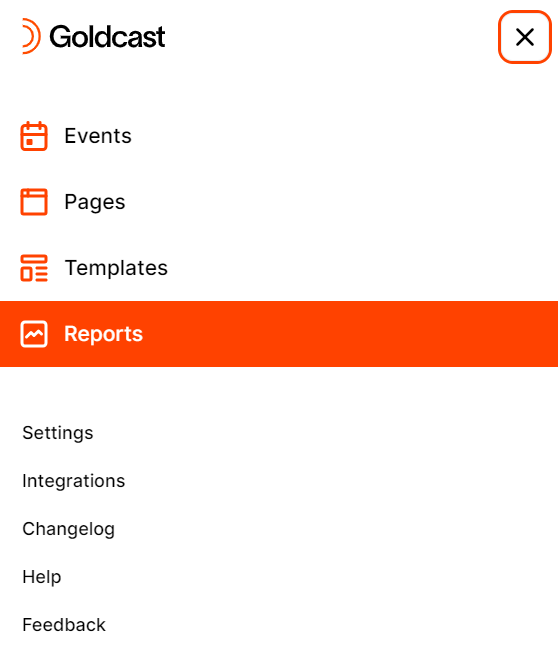
- Click the hamburger icon
 on the top left and select the Reports tab.
 - Navigate to the Cross-Event Reporting page using the left sidebar.
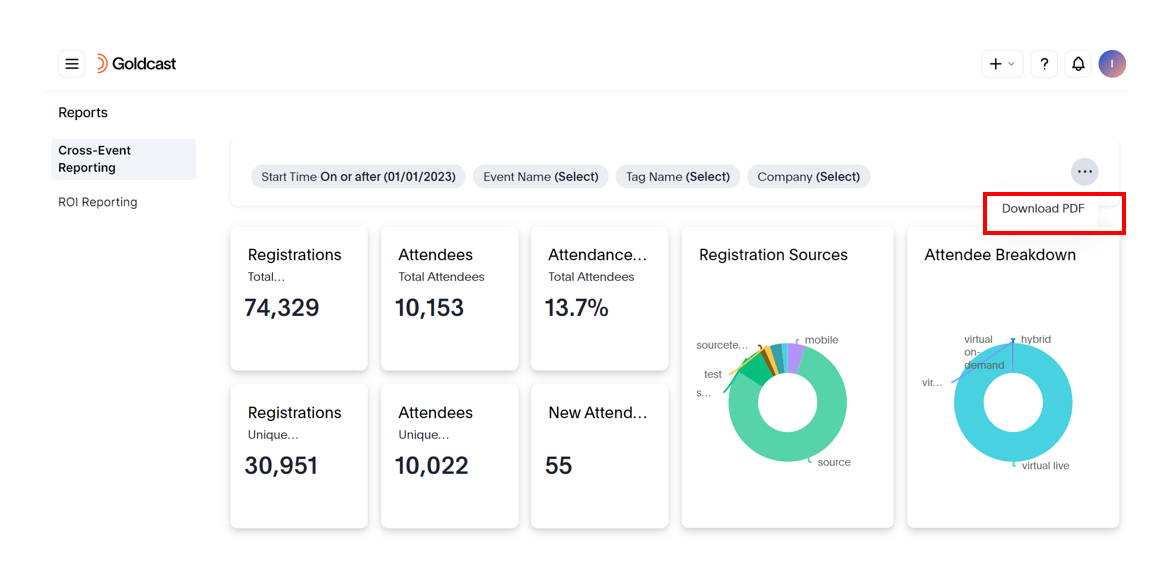
- By default, cross-event reports display all your event data since the beginning of the year. You can change this by using the available Filters on this page.
Filtering the report
You can use filters to refine the data you want to include in cross-event reports:
- Once you’re on the Cross-Event Reporting page, click the Event Name setting to open the Event Name window.
- In the Include tab, you can enter the event name in the search bar or select the events of your choice.
- [Optional] Use the Exclude setting to exclude events from your report data.
- Click the Apply button.
- Click the Event Start Time setting to open the Event Start Time window.
- Select an operator from the Condition dropdown list based on your requirements.
- Select a date from the Date dropdown list based on your requirements.
- Click the Apply button.
- Click the Company setting to open the Company window
- In the Include tab, you can enter the Company name in the search bar or select the Company of your choice.
- [Optional] Use the Exclude setting to exclude Companies from your report data.
- Click the Apply button.
- Click the Tags setting to open the Tags window
- In the Include tab, you can enter the Event Tag name in the search bar or select the Tag of your choice.
- [Optional] Use the Exclude setting to exclude specific Tags from your report data.
- Click the Apply button.
- Click the Company setting to open the Company window
-
- In the Include tab, you can enter the Company name in the search bar or select the Company of your choice.
- [Optional] Use the Exclude setting to exclude Companies from your report data.
- Click the Apply button.
-
 Note: The filters you use are cumulative. This means that the subsequent filter you select acts on the data filtered by the previous one.
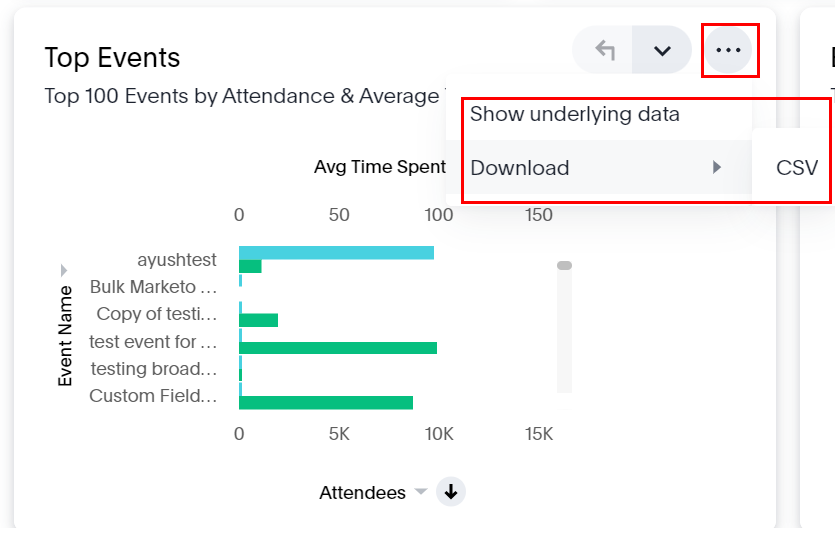
Downloading the report
Click the ellipsis icon 
Visualizations in reports
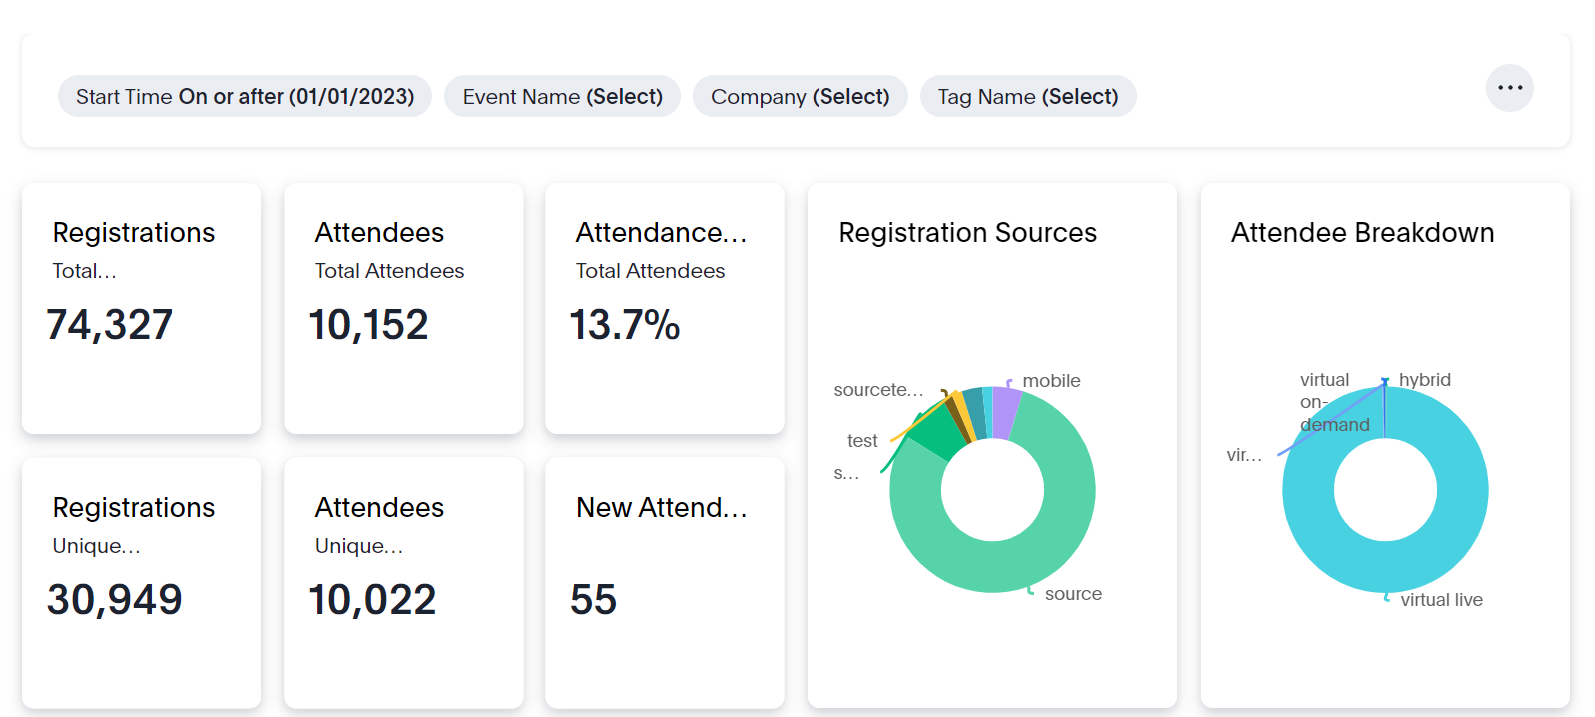
KPIs
- Registrations - This metric represents the total number of Registrations for your event.
- Attendees - This metric represents the total number of Attendees from the registrations for your event.
- Attendance Rate - This metric represents the attendance percentage from the total event registrations.
- Registrations (Unique Registrations) - This metric represents the number of Unique individual Registrants.
- Attendees (Unique Attendees) - This metric represents the number of Unique individual attendees.
- New Attendees - This metric represents the number of attendees who came to your event for the first time during the Event Start date range selected for the report. Note: Filtering by Company will not impact this metric.
Charts
-
Registration Sources - This chart shows the source of Registrations such as LinkedIn, X (formerly Twitter), Google, etc. The utm_source parameter collects this data. This chart will be empty if you don’t collect or send this information to Goldcast.
-
Attendee Breakdown - This chart shows how attendees participated in the event, such as virtual live, virtual on-demand, hybrid (in-person and virtual) or in-person.
-
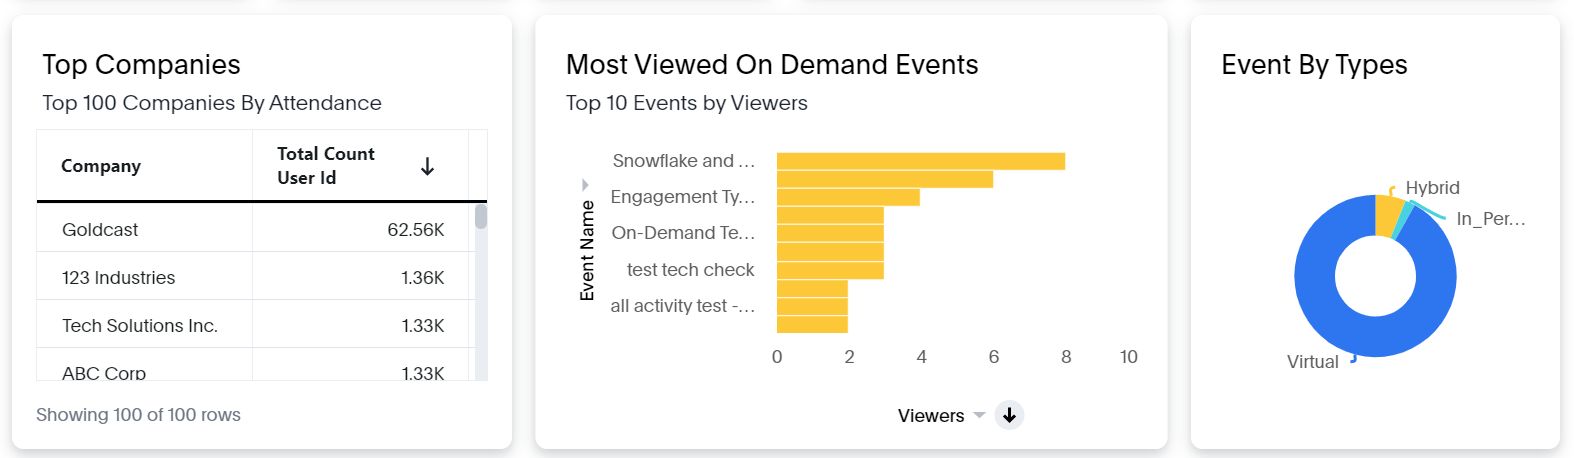
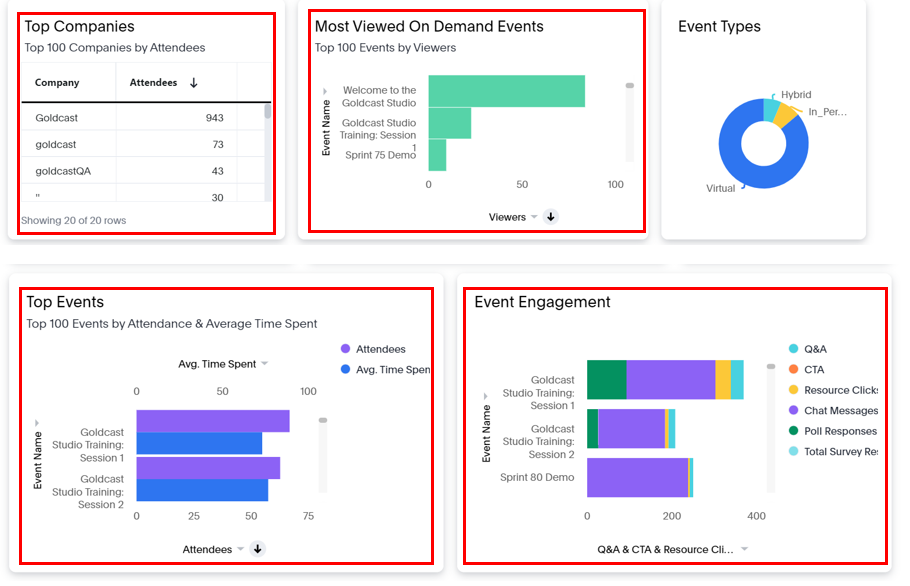
Event Types - This chart shows the number of events per event type, which can be virtual, hybrid, or in-person.
-
Most Viewed On-Demand Events - This chart displays data on the most viewed on-demand events, with the number of viewers per event. This chart will be empty if you don’t make the event available for on-demand viewing on the Goldcast platform.
-
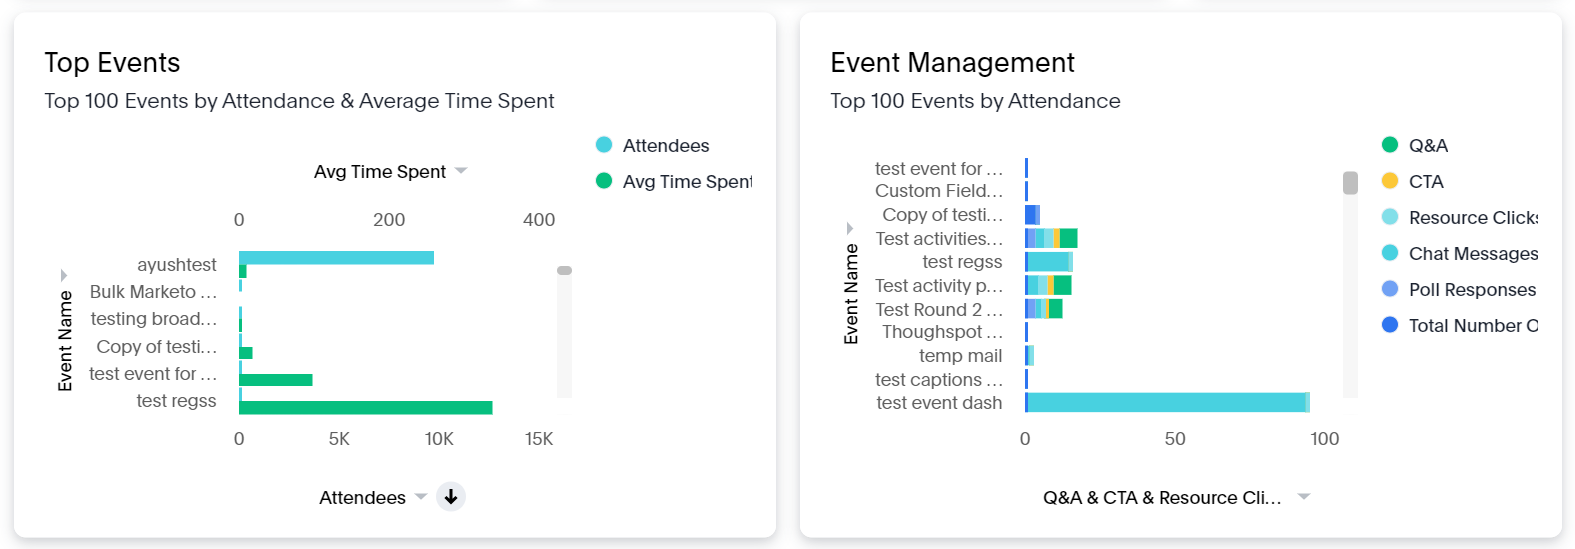
Top Events - This metric shows the number of attendees and the average time spent per event. This chart shows the data for the Top 100 events.
- Event Engagement - This metric shows the engagement data per event, including CTA, Q&A, Resource Clicks, Chat Messages, and Poll Responses. The engagement data for the Top 100 events is shown via attendance count.
Customizing charts
The following reports are scrollable. Use the scroll bar on the right of the visualization to see more information.
- Top Companies, Most Viewed On Demand Events, Top Events, and Event Engagement
Click the three dots on the table/chart to see the following settings:
-
Show underlying data: In the Underlying data table, you can add/remove columns using the Edit Columns option.
- Download CSV: Use this option to download the report in the .csv format with the selected settings.
- Download: Use this option to download the widget/chart.
The following are the additional settings available for bar charts:
-
Filter: Use this option to apply different criteria and narrow your event(s) data. Click the dropdown list on the X-axis and select Filter. For example, Viewers on the Most Viewed On-Demand Events chart.
- Click + Add condition.
- From the Condition dropdown list, select the operator based on your requirement.
- From the Value dropdown list, add the values based on your requirements. Use a semicolon (;) to separate multiple values.
- Click the Apply button to save.
- Sort: Use this option to sort by ascending or descending order. Click the dropdown list on the X-axis and select Sort.
Tabular report
- Top Companies (Top 100 Companies by Attendees) - This tabular report displays the top 100 companies with the number of attendees per event.
Customizing report table
The Top Companies leaderboard tabular report has additional options:
- Download CSV: Allows users to download the report in CSV format. Click the three dots on the right corner of the widget to see the option Download CSV.
- Show underlying data: In the underlying data table, you can add/remove columns using the Edit Columns option.
Drill down
You can drill down to obtain more specific information, such as a list of attendees from a particular company by their email.
- Right-click the company name in the table to view the context menu.
- Select Drill Down from the menu to view the fields to drill down to.
- Select the field, such as emails. The table will update and show the email of each attendee and the number of times they attended your events.
- You can now download this data as a CSV.
- To navigate to the original table, click the Undo or Reset button.
FAQs
When trying to access cross-event reporting, I’m seeing the following error. How do I resolve it?
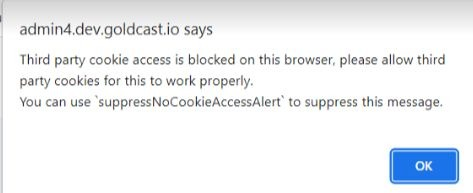
If facing this issue, don’t open Goldcast Studio in Incognito or Private mode. See the solution below based on the browser you are using.
Google Chrome
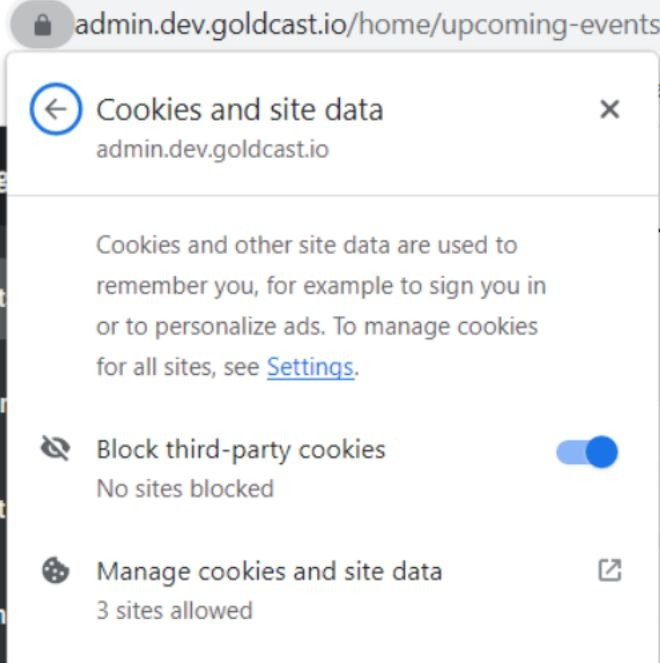
- Click the lock icon beside the URL
- Click Cookies and site data.
-
Turn on the Block third-party cookies toggle.
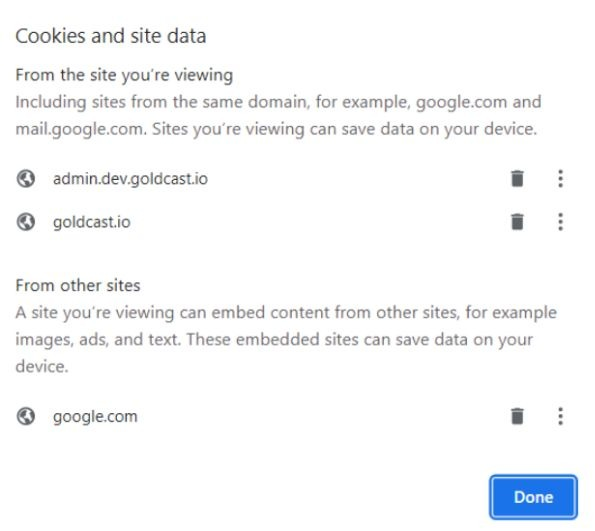
- Click Manage cookies and site data.
- Click the Delete icon to delete the site from the cookies and site data. Apply the same for all Goldcast sites in the cookies and site data.
- Click Done to save the setting.
Now, go back to Goldcast Studio, try logging in, and refresh the page to load the app.
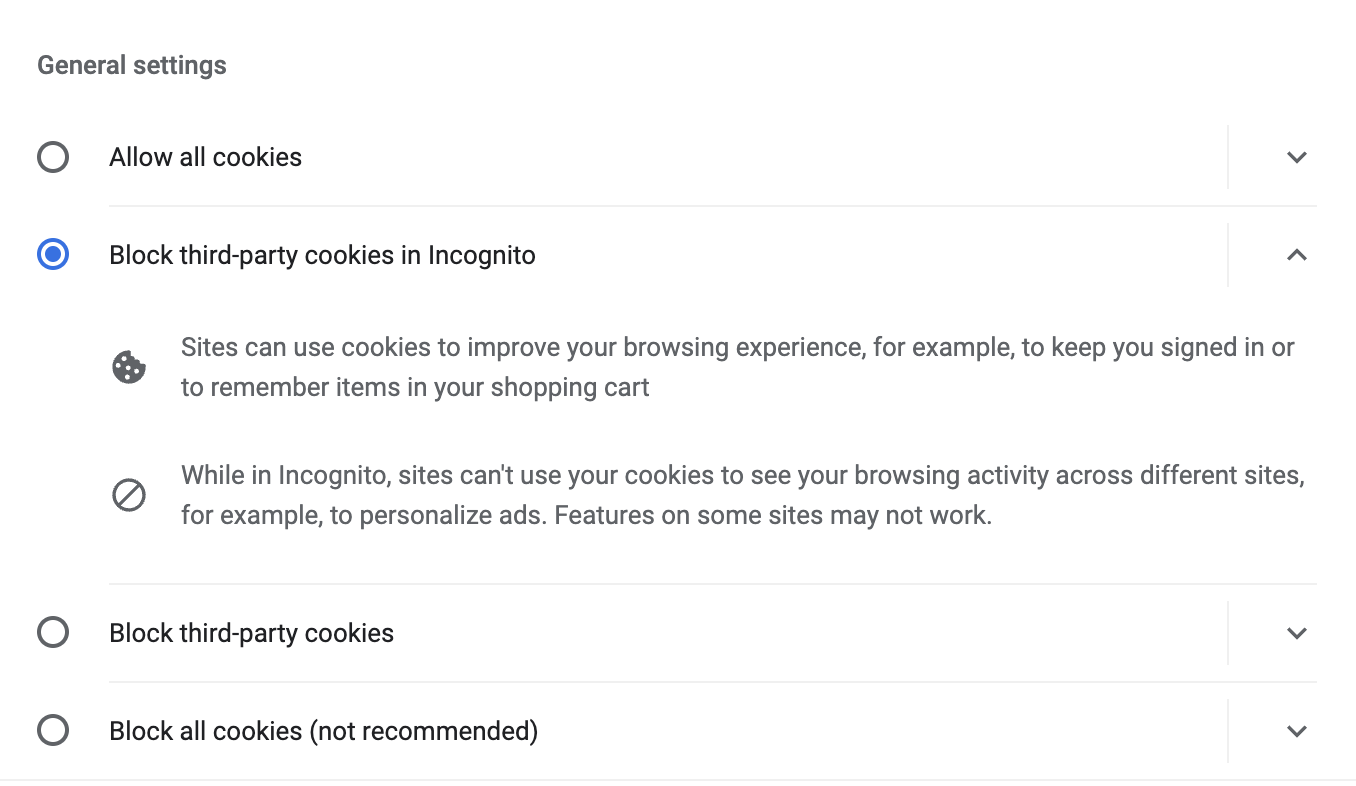
If you want to open the Goldcast environment in Incognito or Private mode, choose Allow All Cookies.
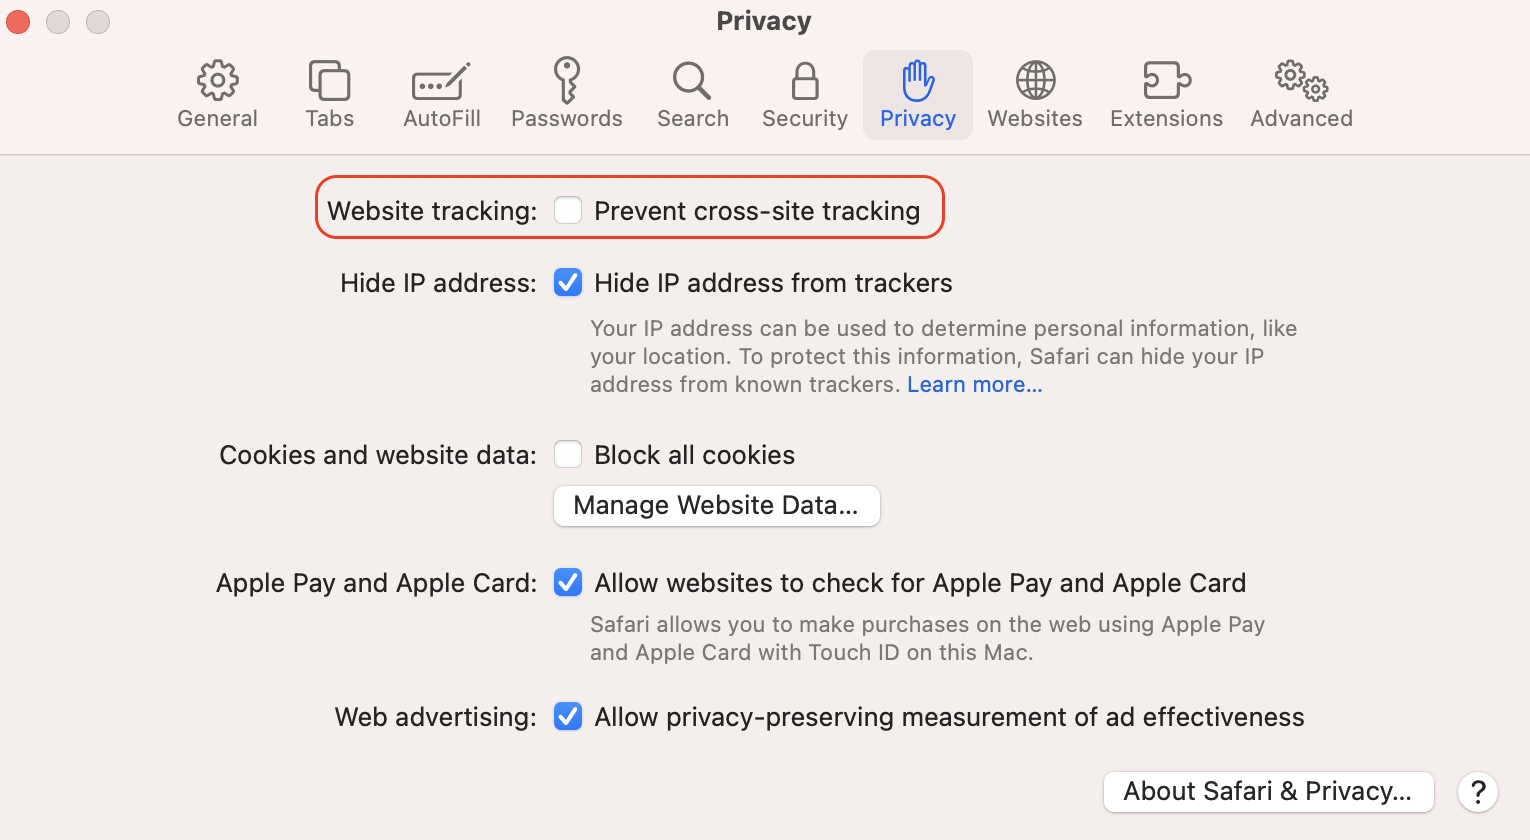
Safari: If you use a Safari browser, turn off Prevent Cross-Site Tracking using the following options in the image.